

Data-U • Mixed Reality Experience
Case study or project summary headline
Lowering the barrier to entry for engaging with research data with immersive interactive experiences.
Project Objective
Create an immersive way for people to interact with both quantitative and qualitative research materials.
role
Design Technologist
timeline
5 months
core team
3 Design Researchers
1 Design Technologist
Key Skills
Immersive design
Spatial design
XR/VR prototyping
Design research
tools & methods
Unity
Enklu
User interviews
Quantitiative research
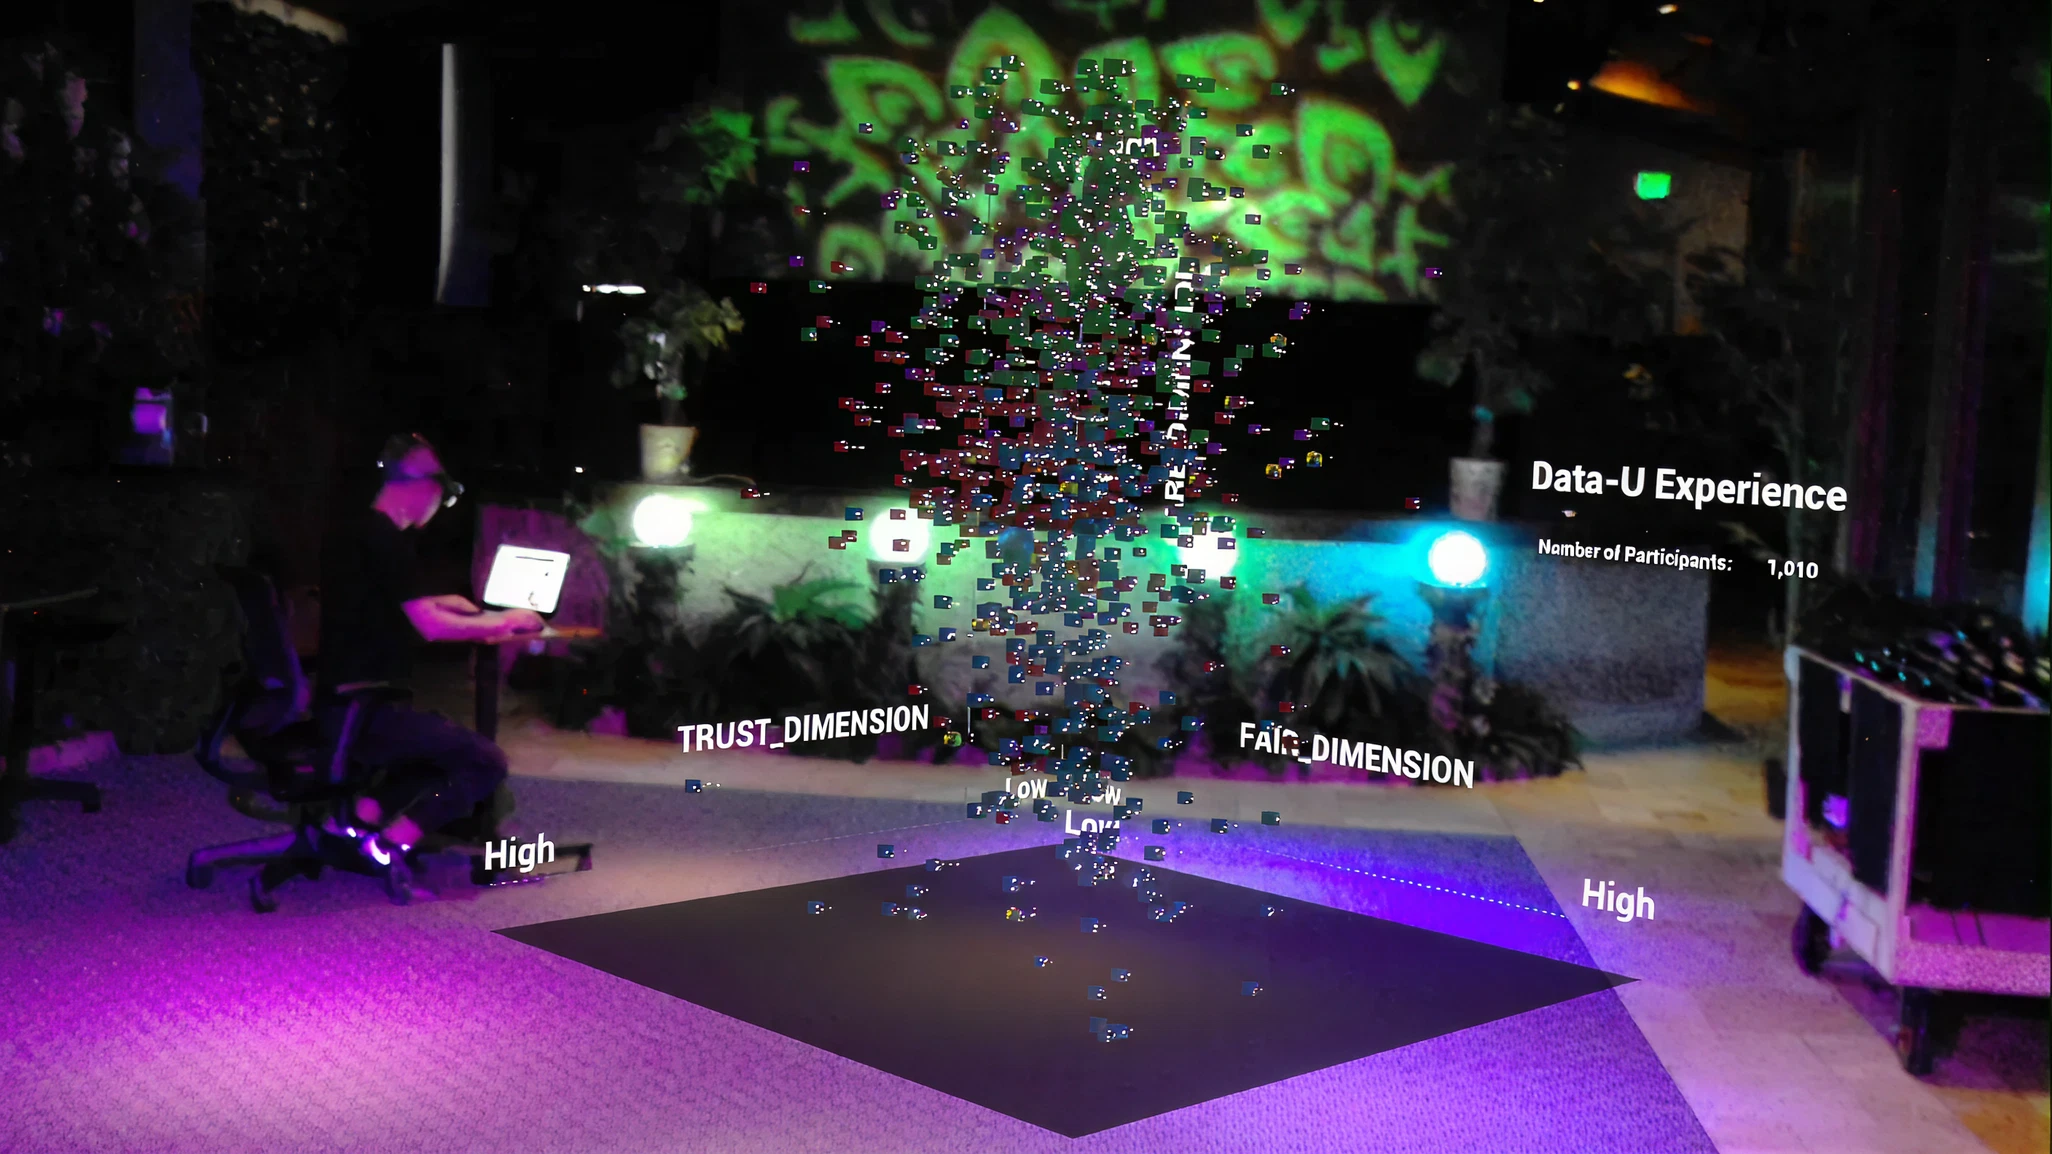
The Experience
Data-U is a 3D immersive experience for interacting with multi-variable datasets.
While originally built as a mixed reality experience for Hololens, it has been adapted here so that you can experience from your desktop browser
open in new tab

Project Background
“What if you could walk into the data?”
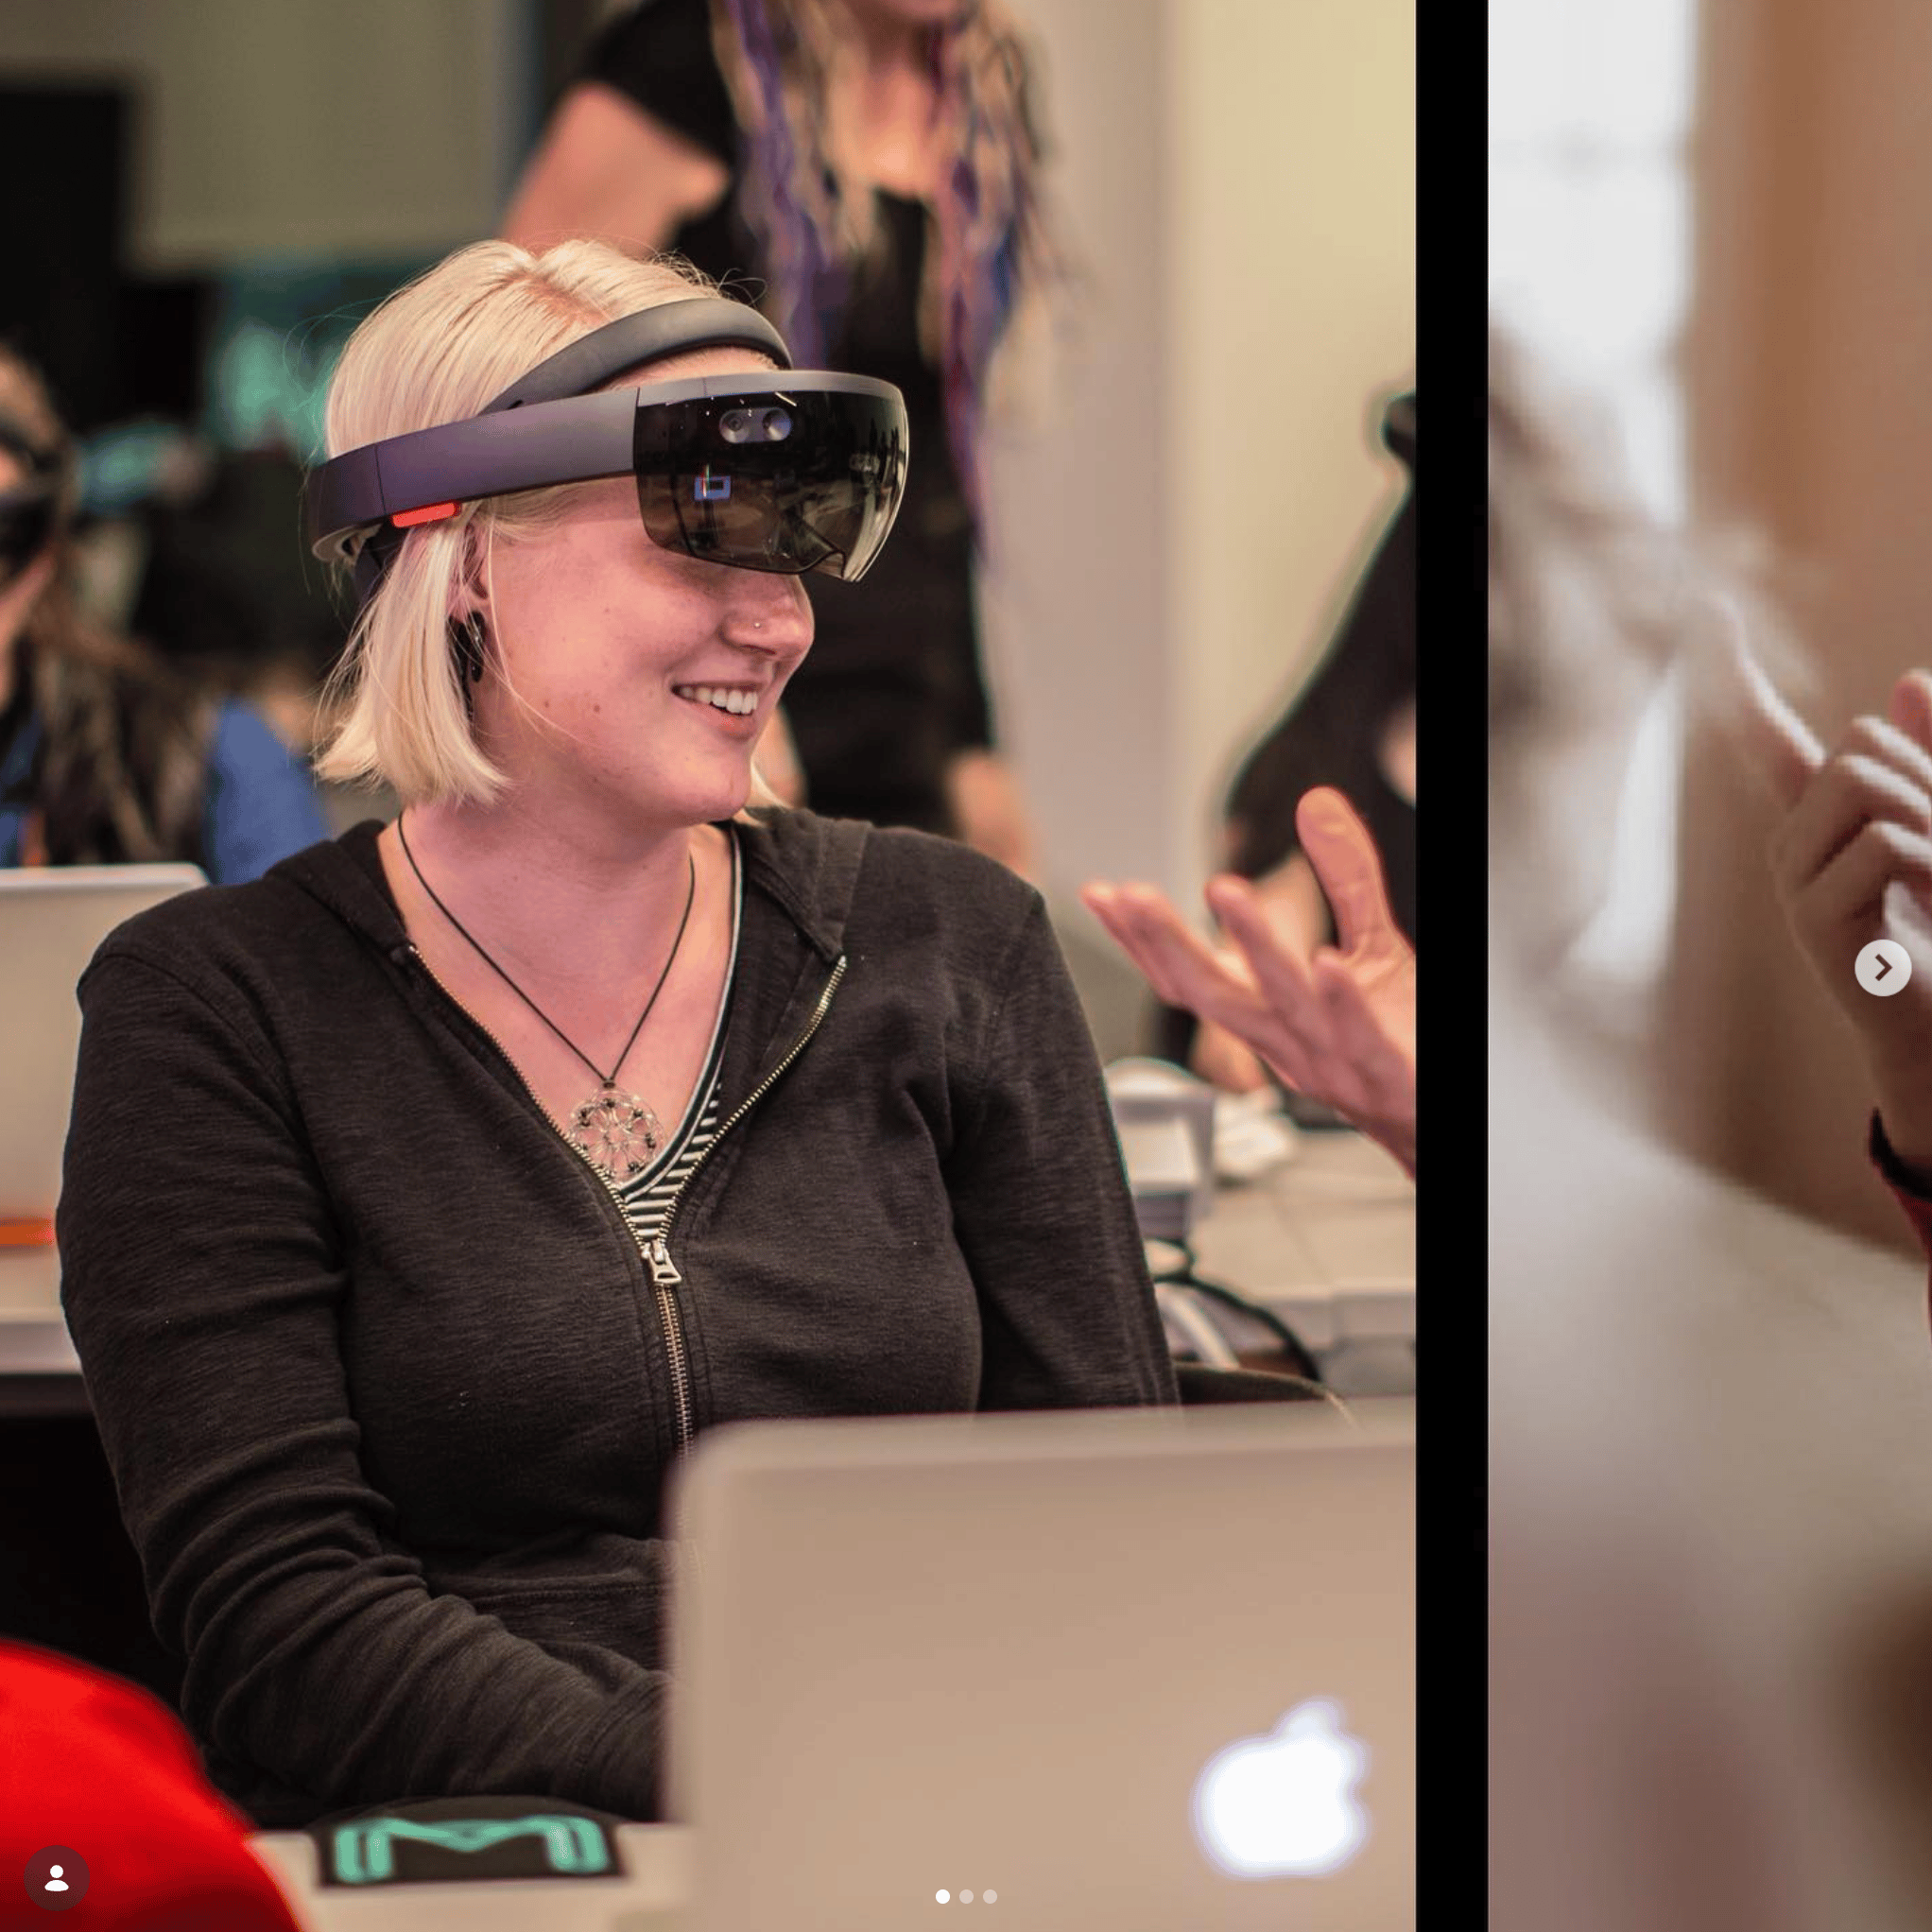
I was sitting in a room full of design research students, listening to the discussion about quantitative data synthesis, variable clustering, and graph visualization, and trying to think of a way to make it not so... boring?
It’s easy enough to get an audience of everyday people invested in the outcomes of qualitative research—there’s people and quotes and context and sometimes even photos and videos too. It reels us in, primed by one of the most fundamental traits of the human species: storytelling.
But it’s a lot harder to do that with quantitative research data. Charts and graphs and numbers are pretty boring to most people. Sometimes there’s an attention-grabbing number that’s worth a news headline, but unless you’re personally invested in the context and outcomes of the research, then the data on it’s own isn’t going to be that compelling.
At the time, I was working on my thesis project on spatialized embodied computing and had already spent the better part of the past year leading up to this moment thinking about ways to take traditional “computing” experiences and bring them back out into the human world again, so I posed the question:
“What if you could just walk into the data graph itself and interact with it that way?”
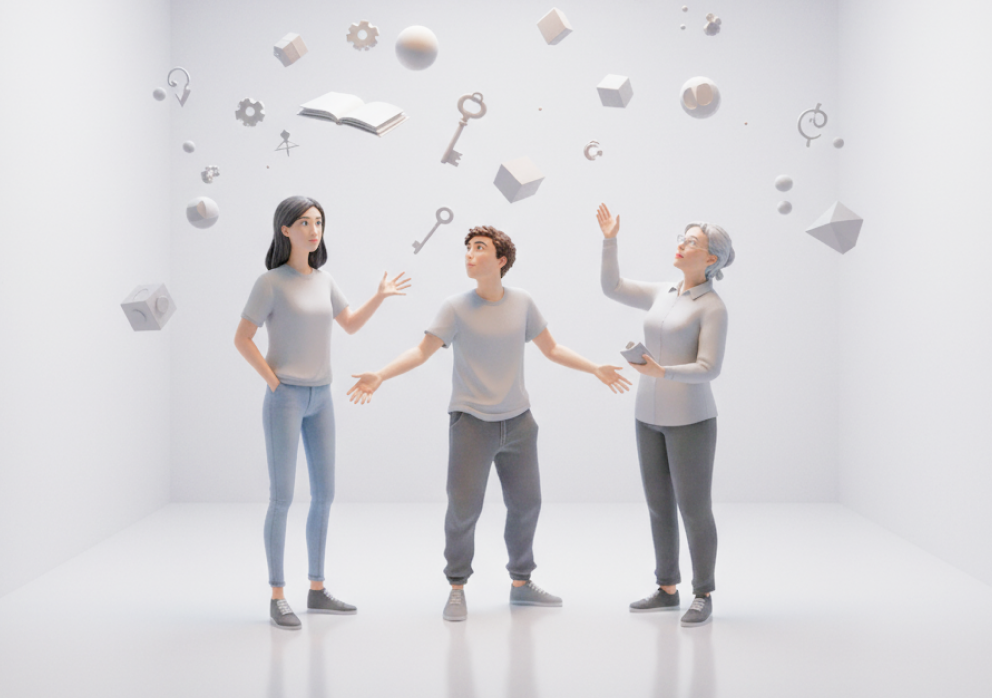
Somewhere else in the room, another question had begun to form how mixed-methods research might be used to understand people’s thoughts and feelings around the rising issue of online data privacy.
But as a social project intended to spark discussion within the general public, they needed a compelling way to share the results at the end of it—to really draw people in. So we decided to join forces.
objectives
This project had two independent but complimentary goals:
1
Interactive Data Immersion
How can we take 3D data visualizations out of being static renderings on small 2D screens and bring them into a shared interactive experience at human scale?

2
Multi-Modal Research
How do everyday people think and feel about their role and the roles of companies, advertisers, and governments within the online personal data economy? (as of 2019)
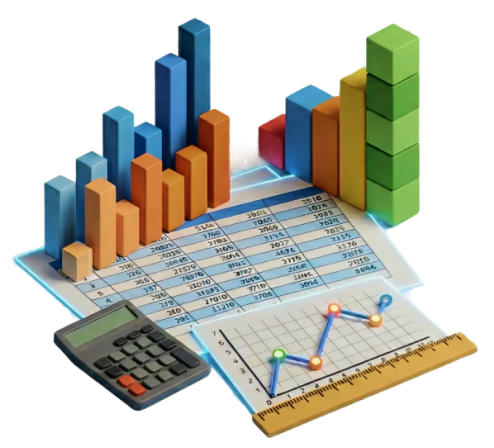
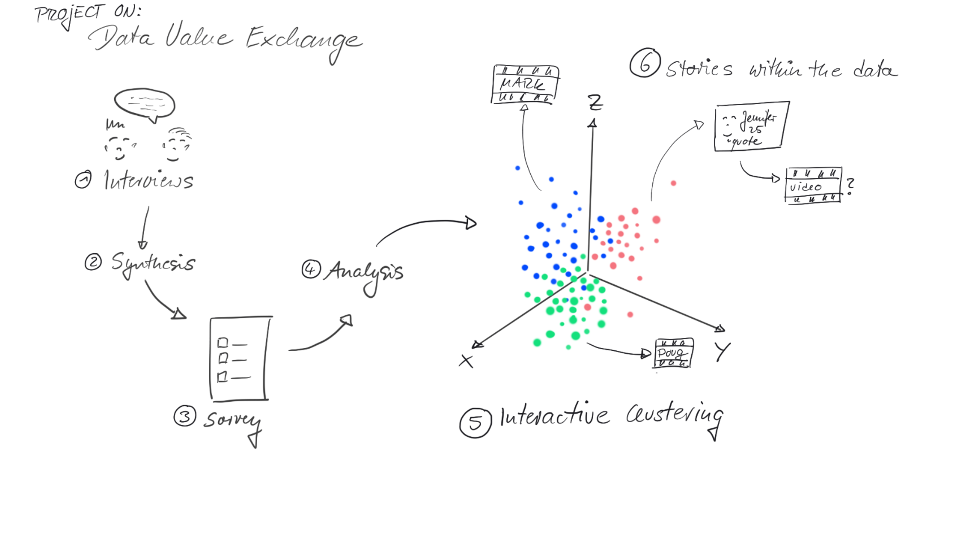
Quantitative
- Survey filled out by 1,000 randomly-selected individuals across the United States.
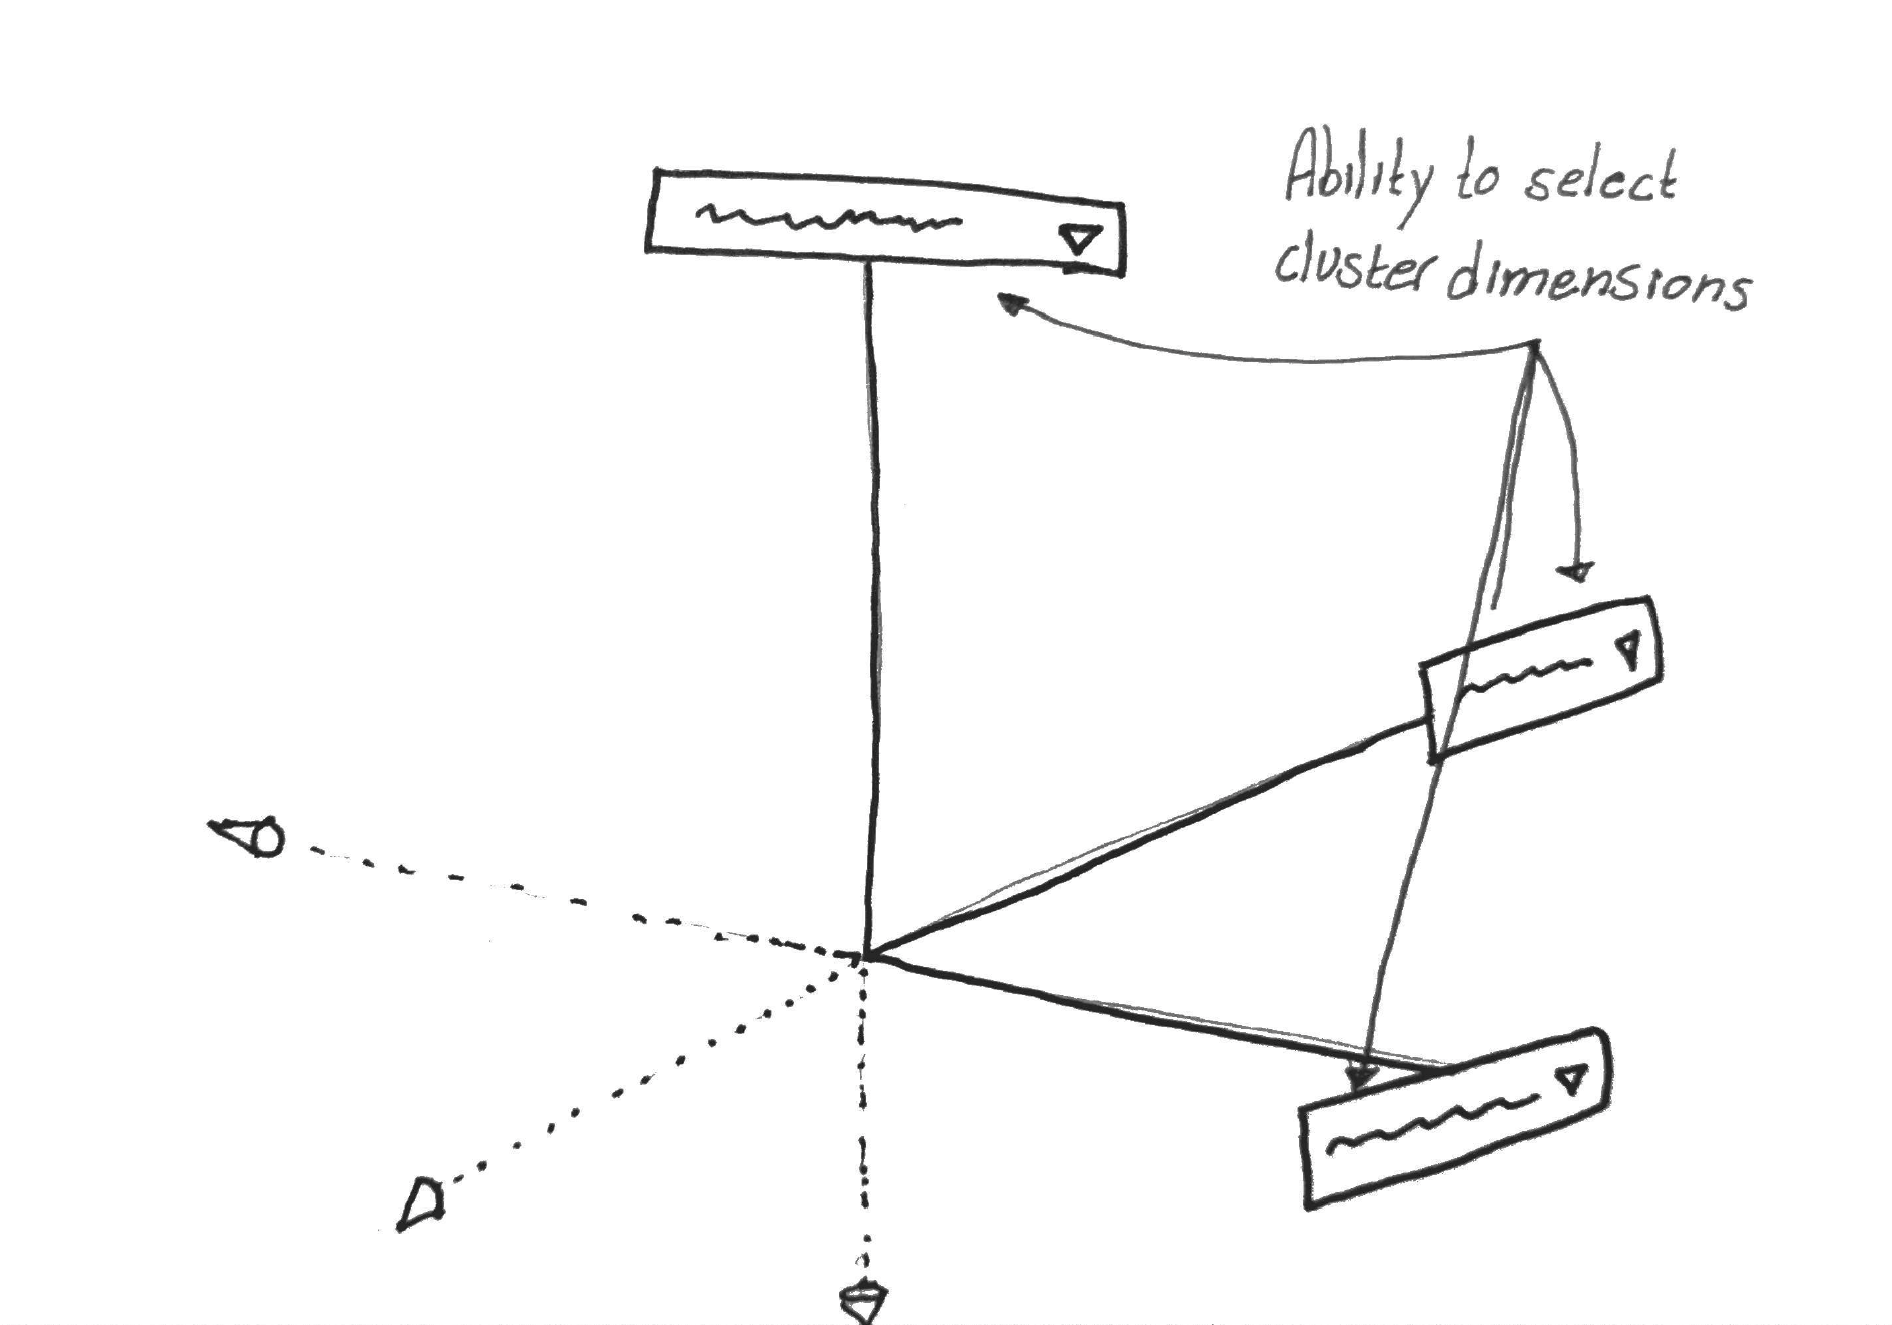
- Results synthesized to identify key dimensions and clusters across responses
+
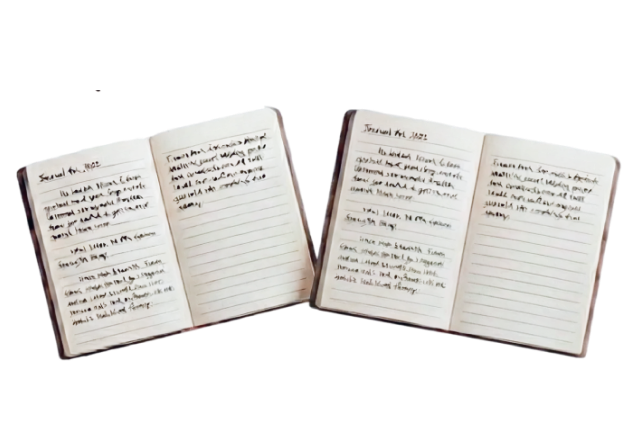
Qualitative
- In-depth interviews with ~20 survey respondents
- Key quotes and stories identified for clips
To learn more about the research behind this project, please visit www.data-u.org
Ideation
While I was kept up to date on the research progress, I wasn’t directly involved in most of it. Instead, my first job was to figure out how to create a 3D data cloud that somebody could “walk” into.
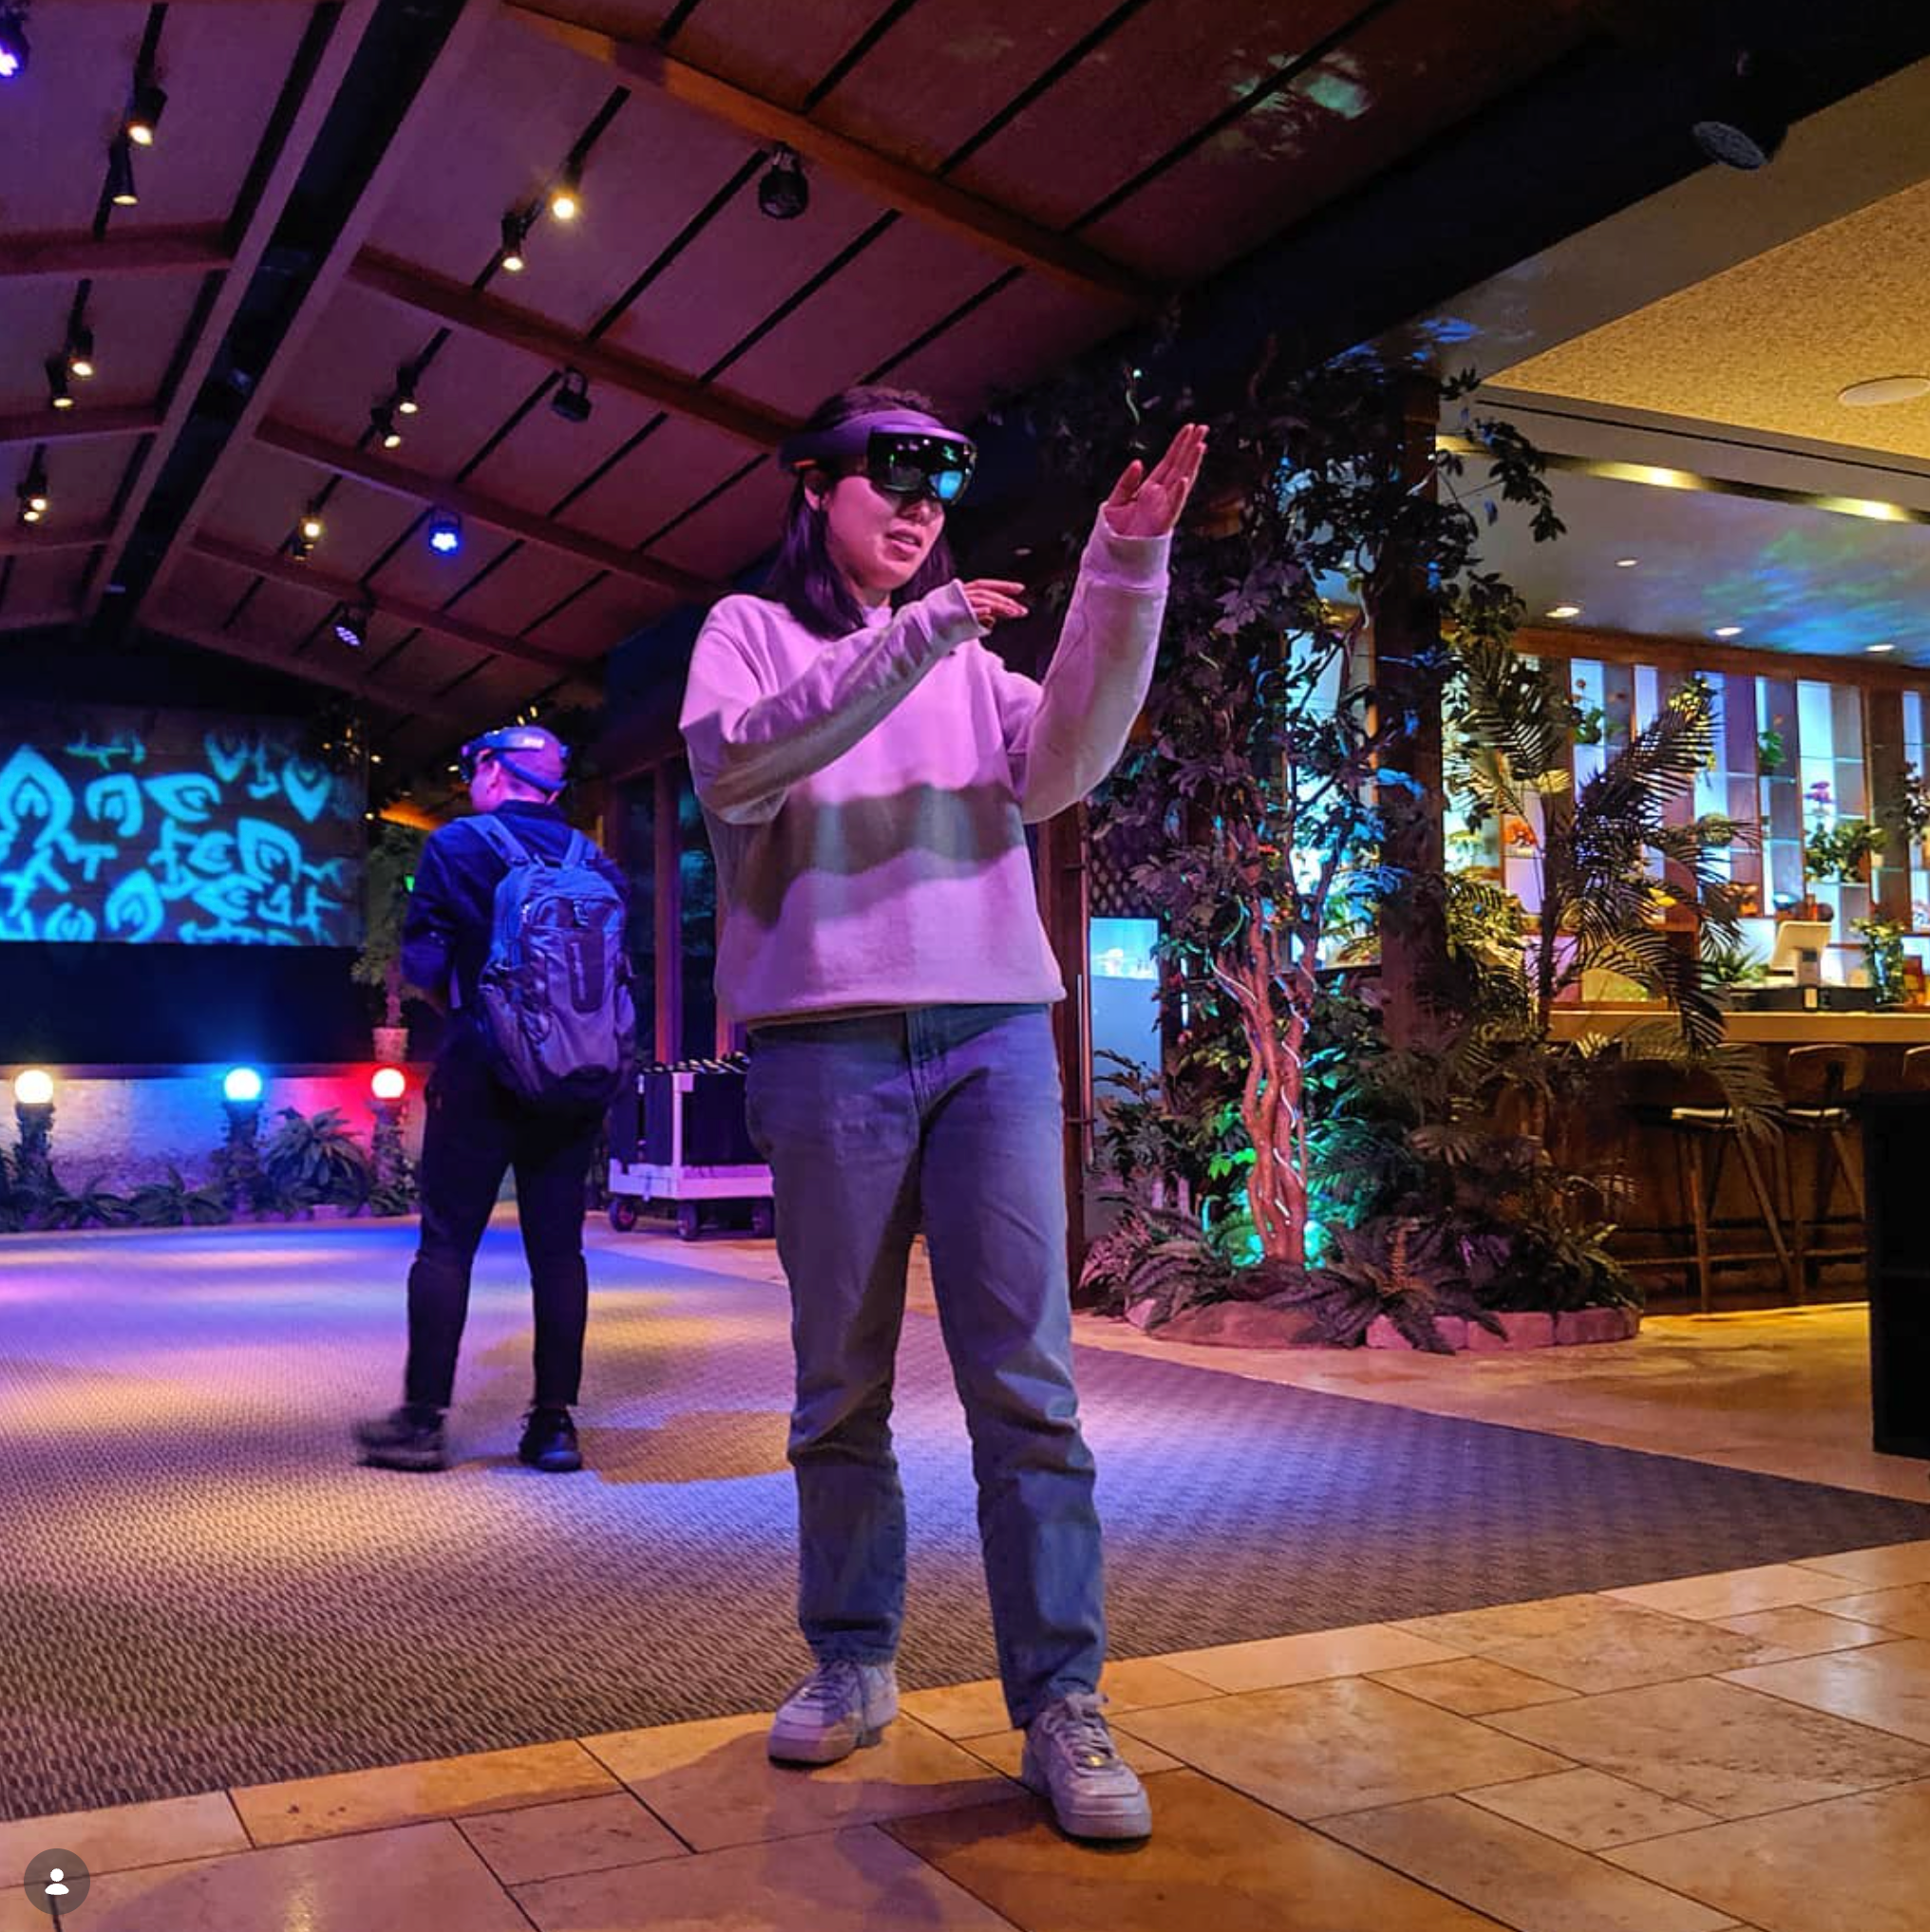
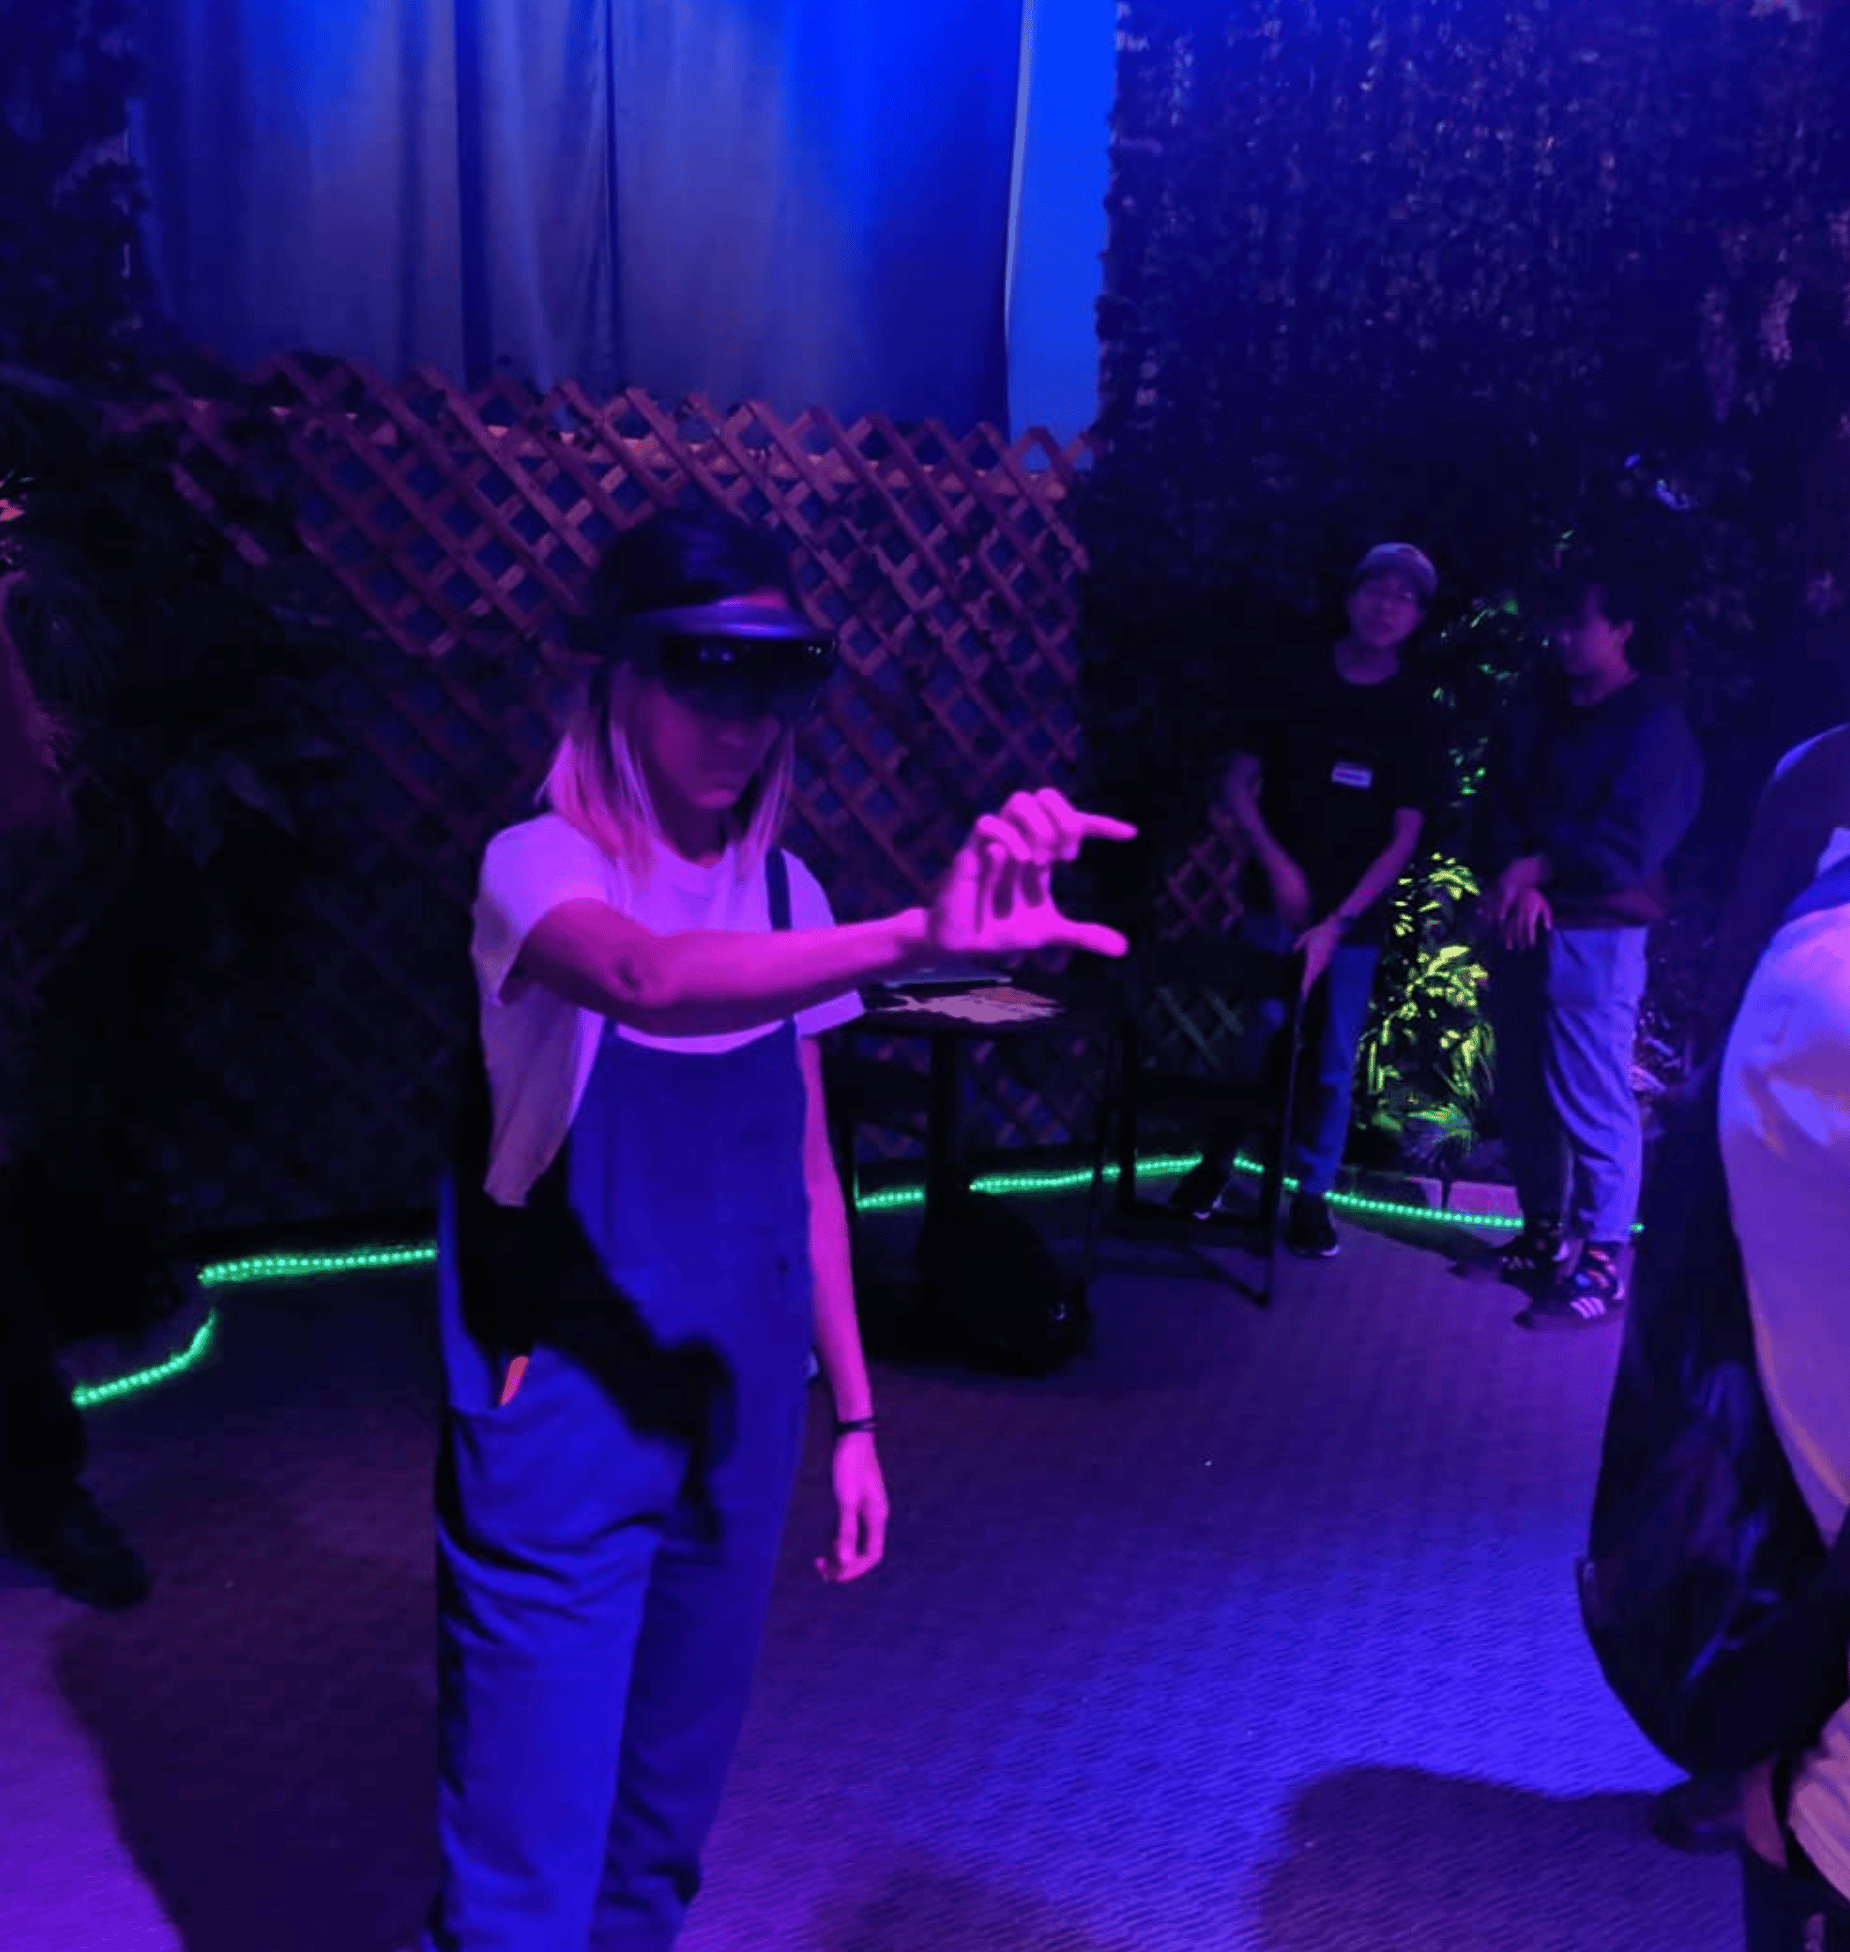
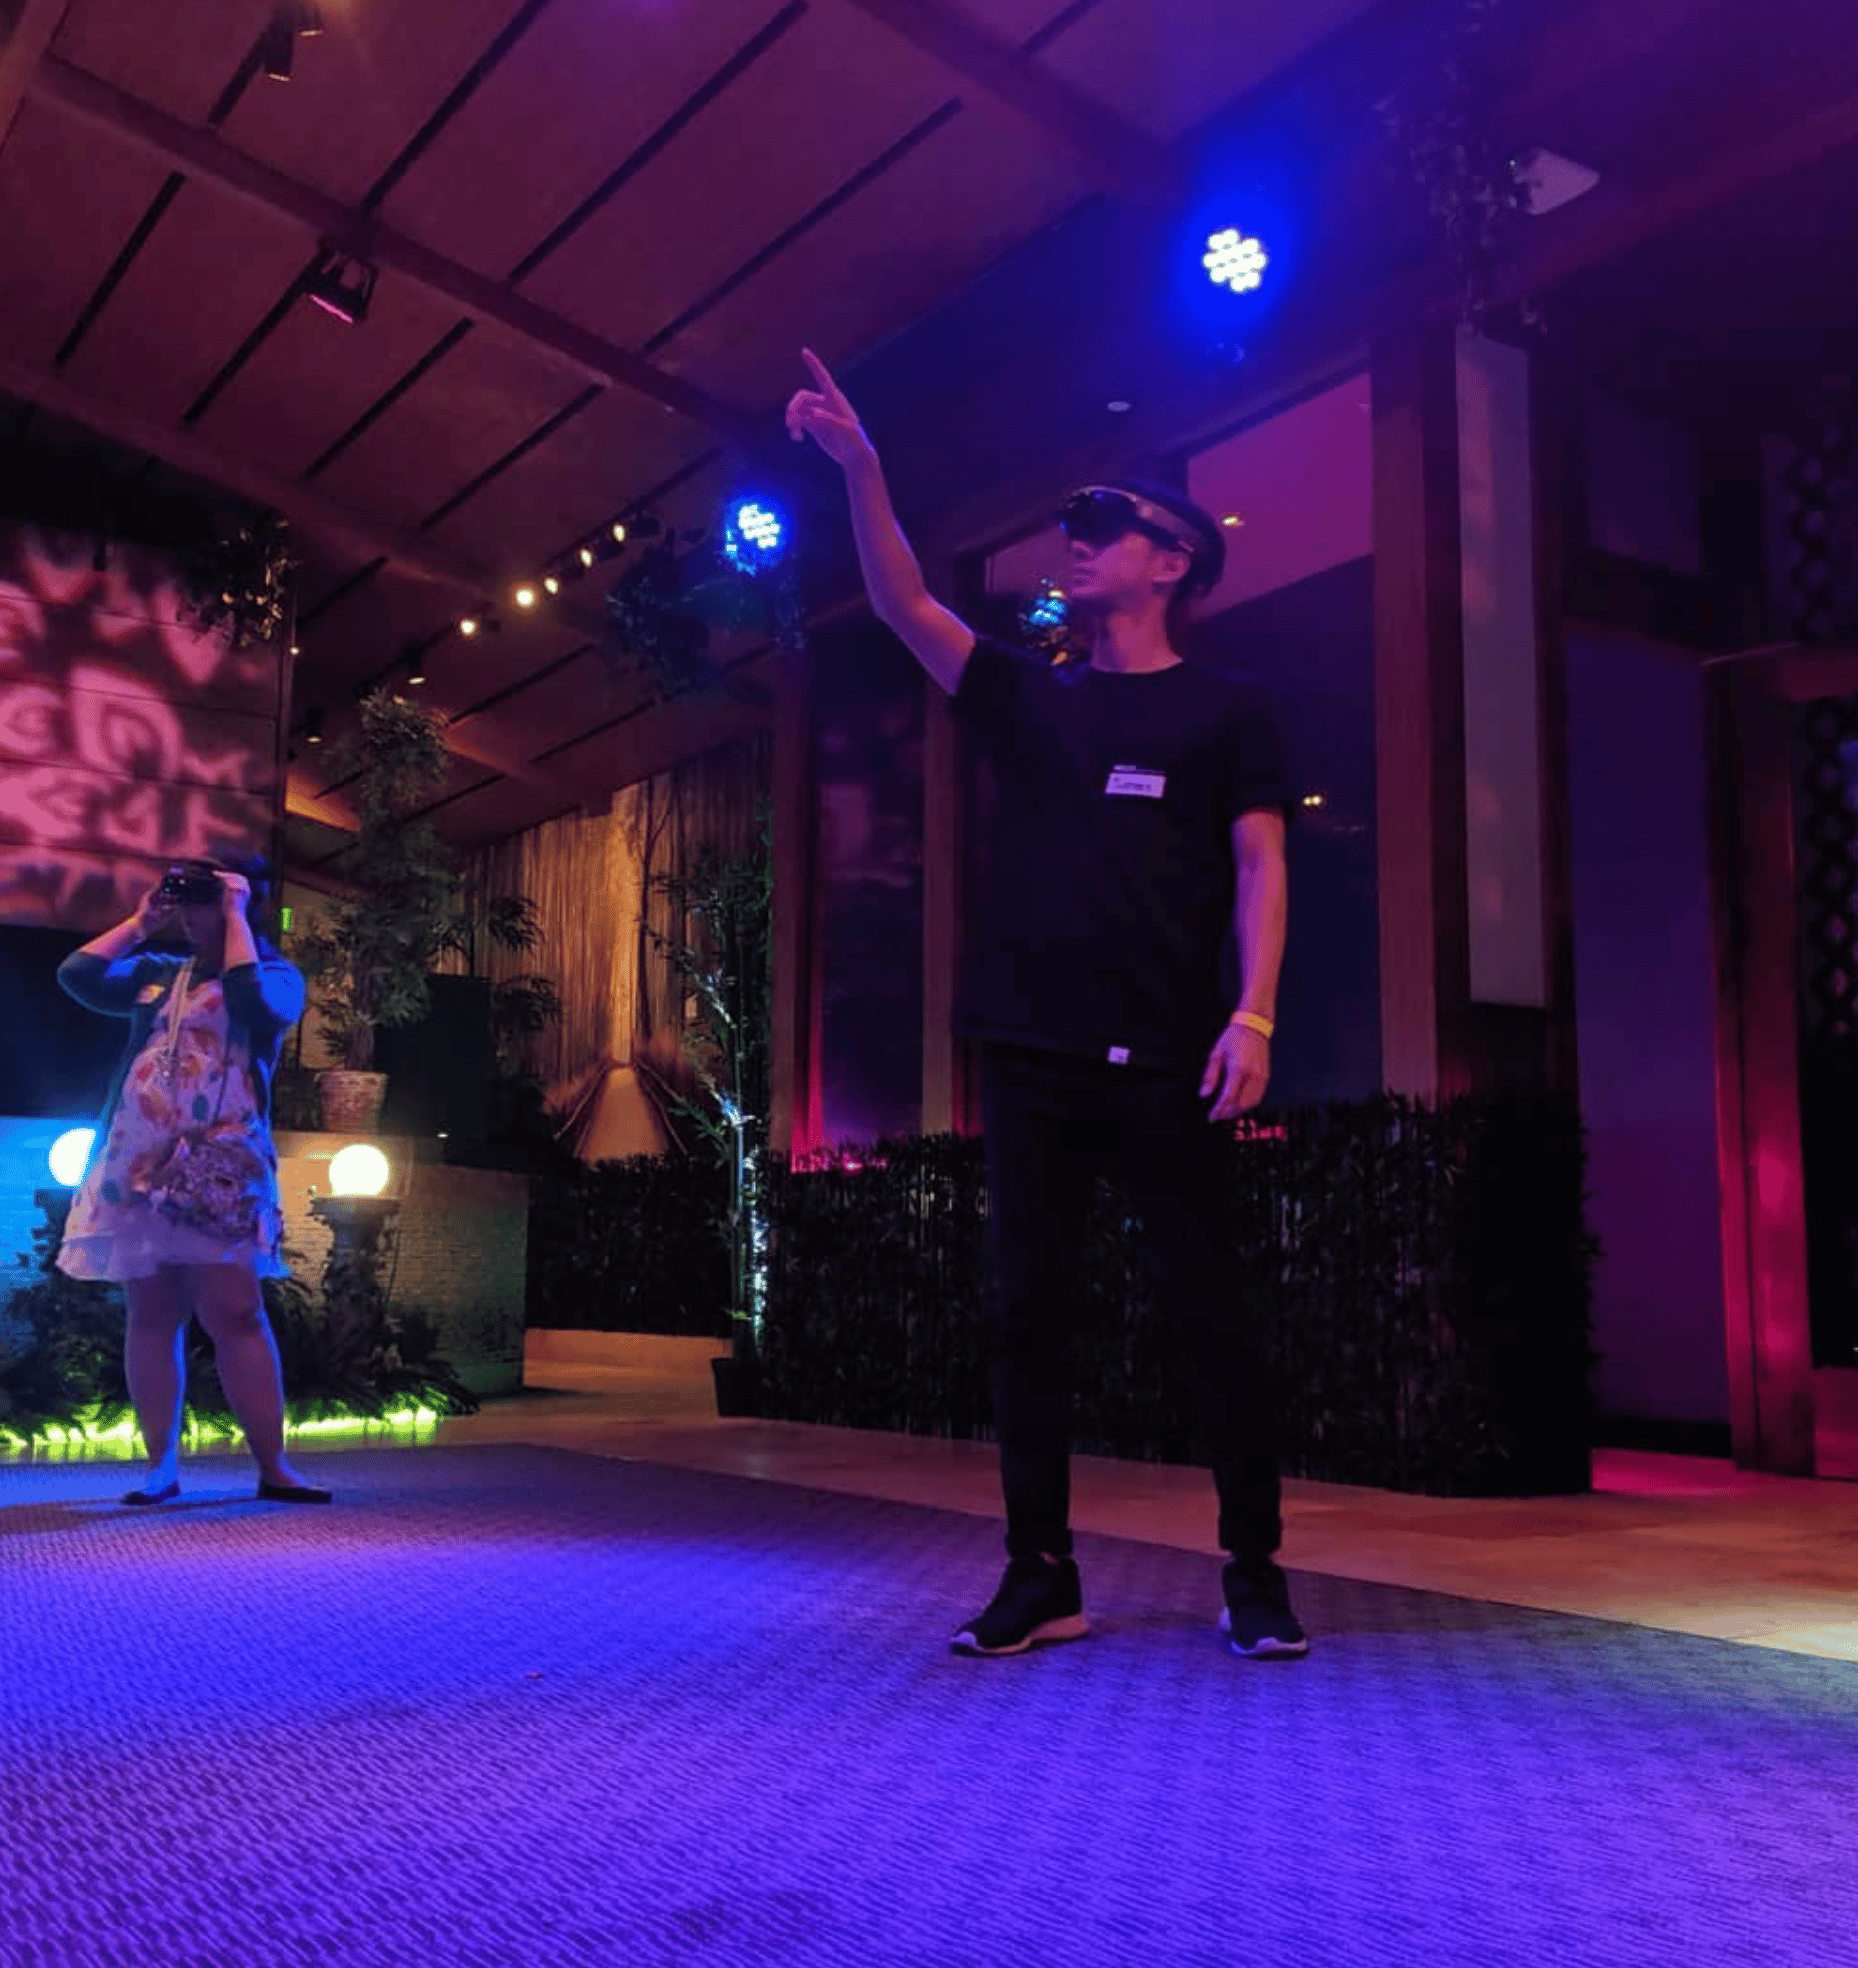
Mixed reality gave us the ability to create an experience that would be both spatially immersive and grounded in the real world.
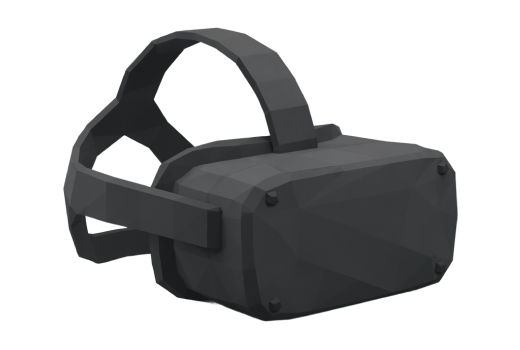
Virtual Reality
Very immersive and spatial, but the team really wanted to keep the experience grounded in the “real” world to draw the line between the physical and digital worlds.

Physical Model
Spatial and tangible, but it would be probably require a permanent site location and would be difficult do for 1000+ individual datapoints.

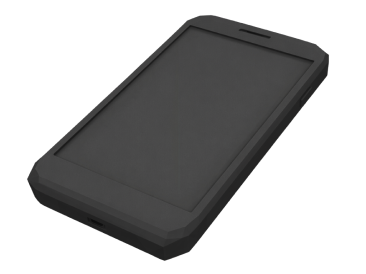
Mobile AR
Accessible but not very immersive— would just flatten a 3D experience back down to 2D to fit on a touchscreen.

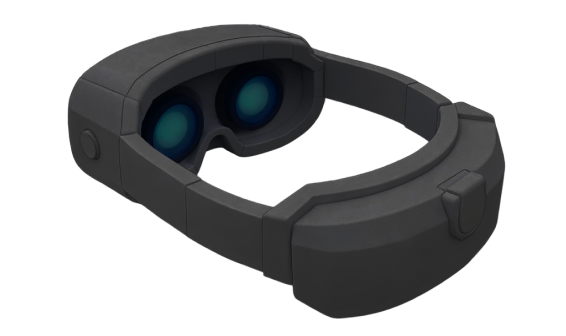
Mixed Reality
Immersive but still grounded in the real world, with the added bonus of allowing people to see and interact with each other.

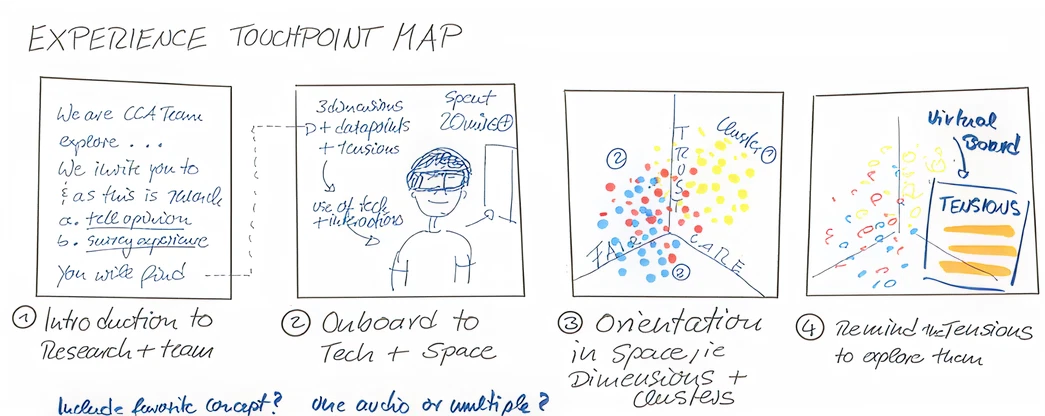
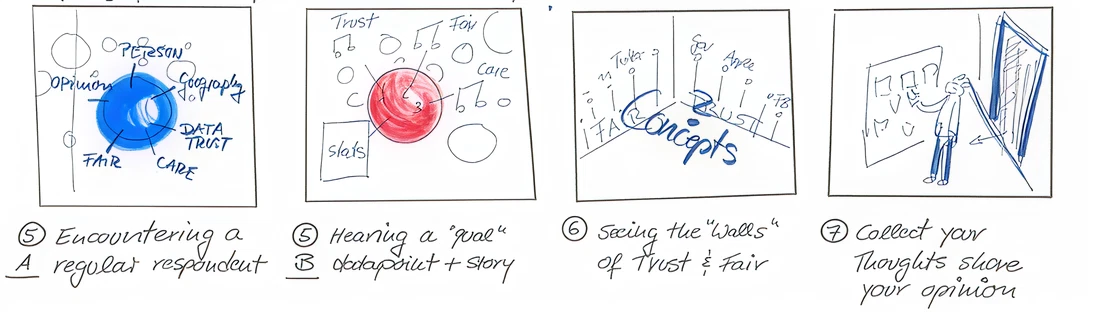
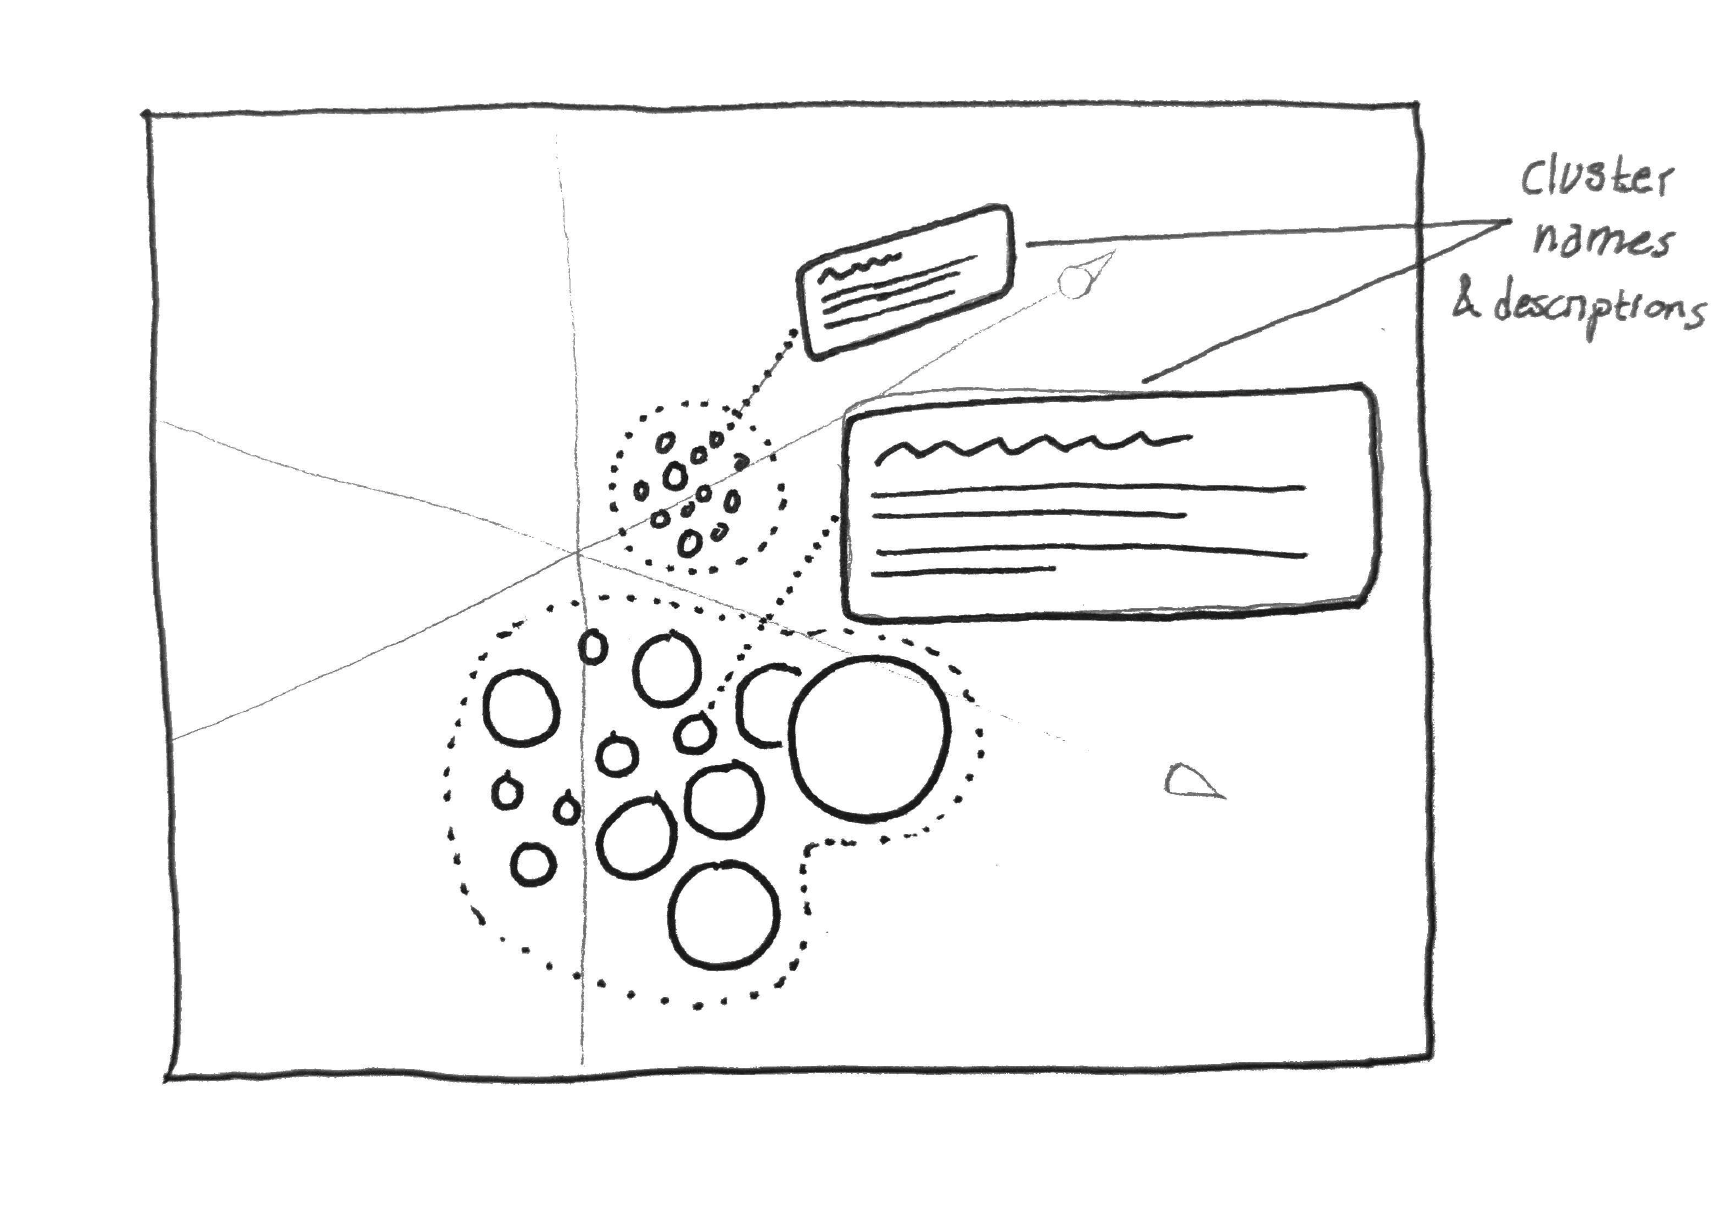
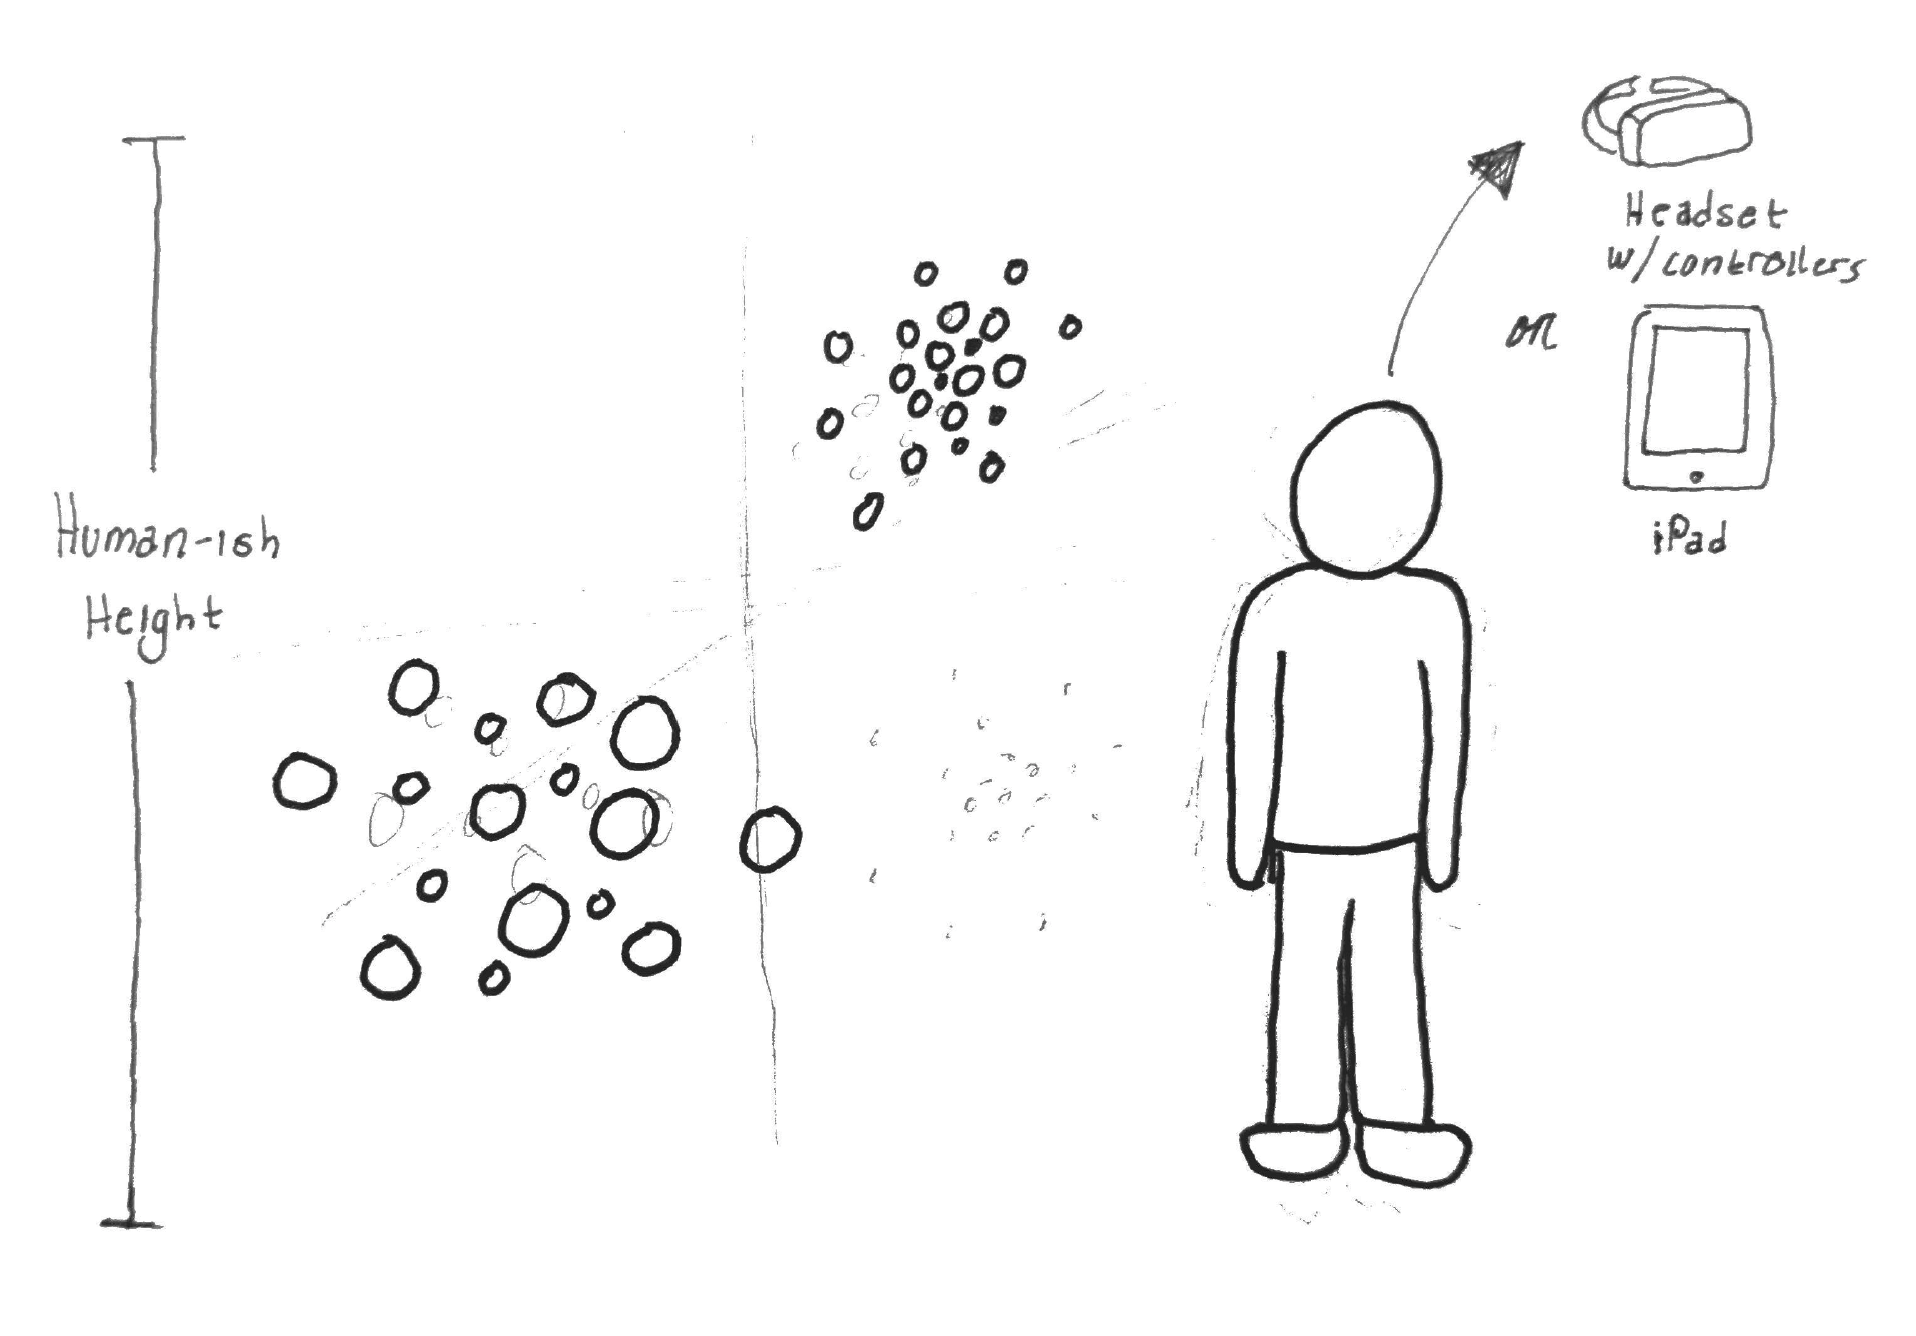
Sketching was an efficient way to explore multiple different ideas for the experience without having to invest time and resources into building technical prototypes.
Prototyping
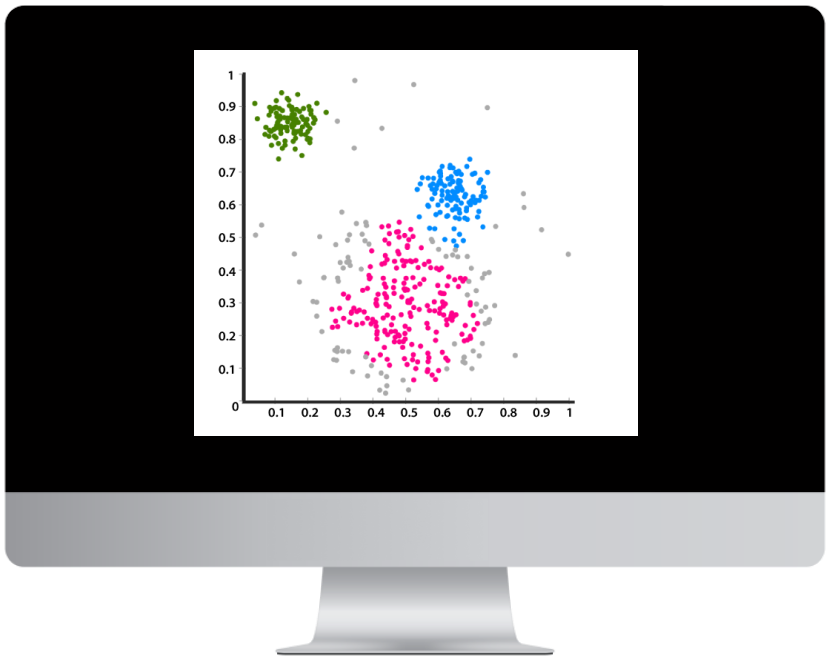
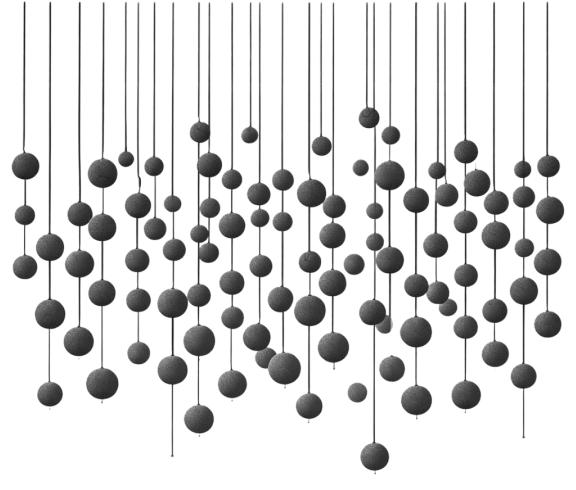
Before even thinking about putting the experience into a mixed reality environment, it was crucial to establish the 3D foundation.
So I fired up Unity and dug in, building off of an existing open-source project for 3D data visualization.(Unfortunately this project has now been deprecated—otherwise I would include link to it here)
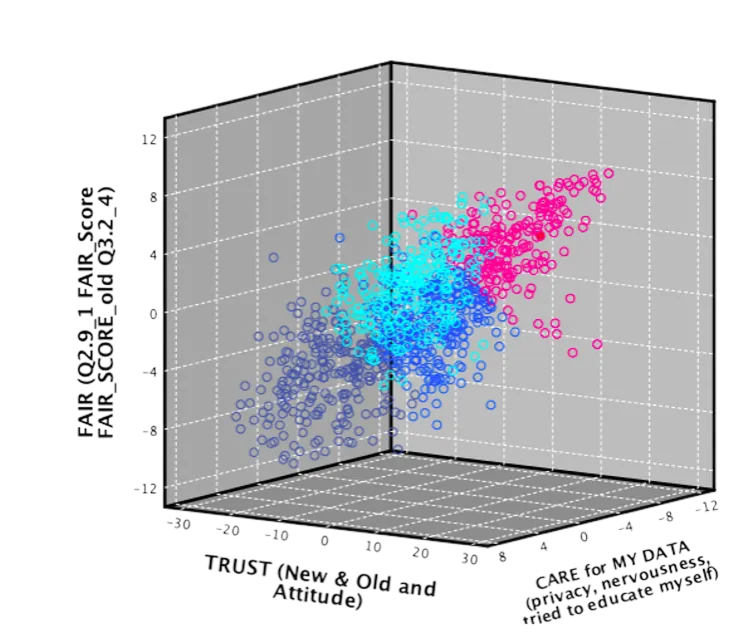
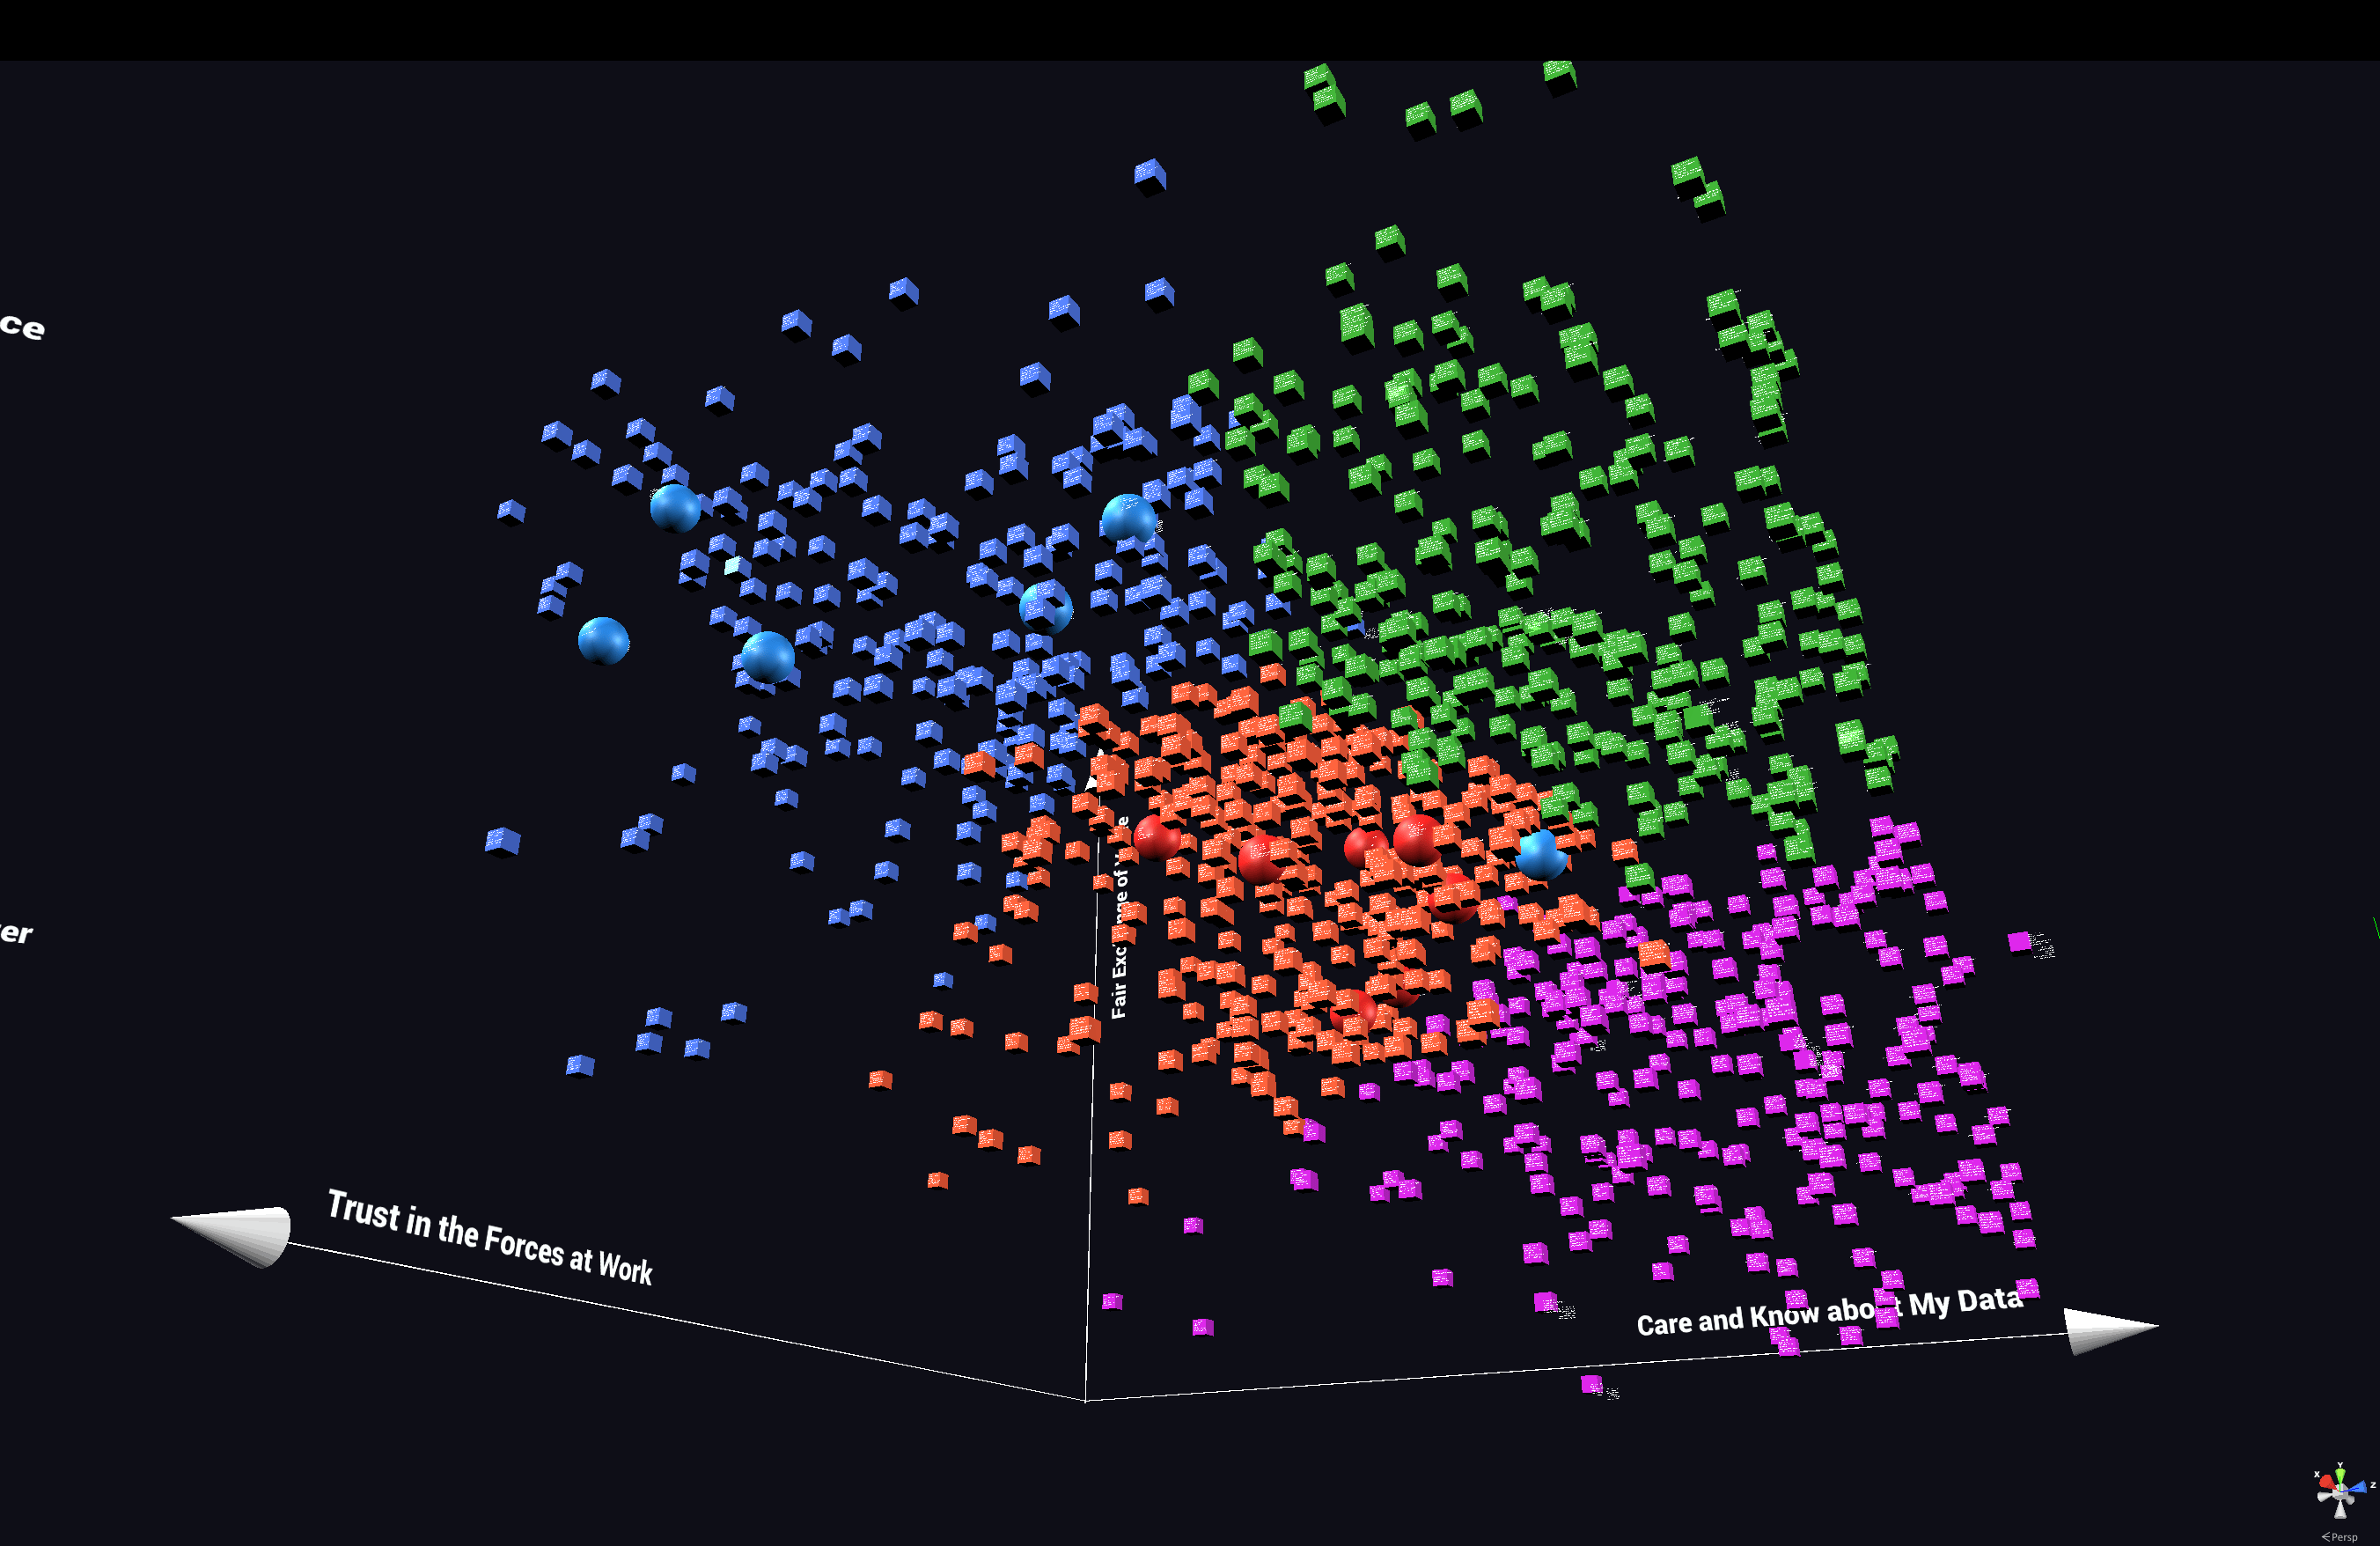
The first step was setting up parameters to map each datapoint across 3 different scaled dimensions and then color coding them based on variable clustering that the research team had started doing.
I focused on establishing the foundational structure and space of the experience before thinking about the nuances of adding in interactions and aesthetics.
Adopting and integrating new tools during the prototyping phase saved valuable development time and resources.
While working on this project I discovered Enklu, a web-based platform for building, publishing, hosting, and sharing mixed reality experiences. Their team happened to be local and when they heard about the project, offered to partner with us. The collaboration helped immensely with scripting and debugging, and also gave us access to their inventory of Hololen 1 devices.

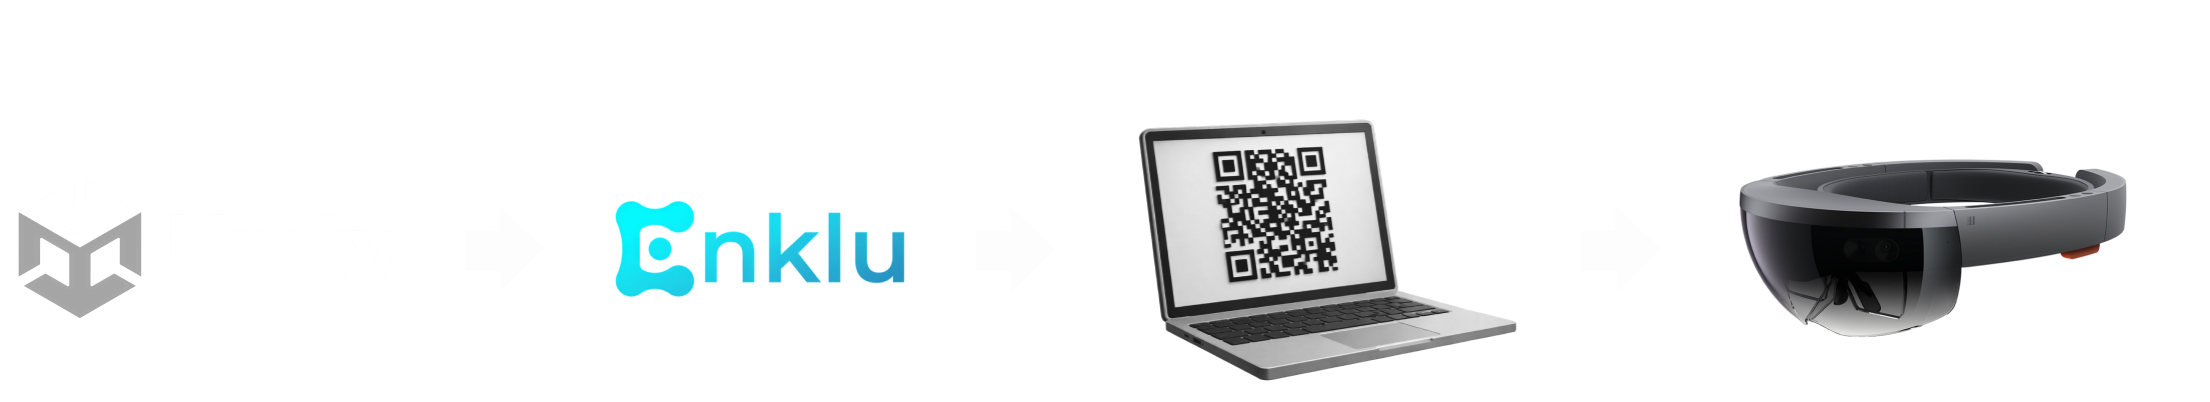
Instead of going through the tedious process of manually setting up XR packages and special build profiles in Unity, we could just upload a scene to Enklu’s web editor, generate a QR code, and then immediately load that scene directly onto a Hololens device.
Technical constraints turned into opportunities for adapting the prototype while still centering the human experience.
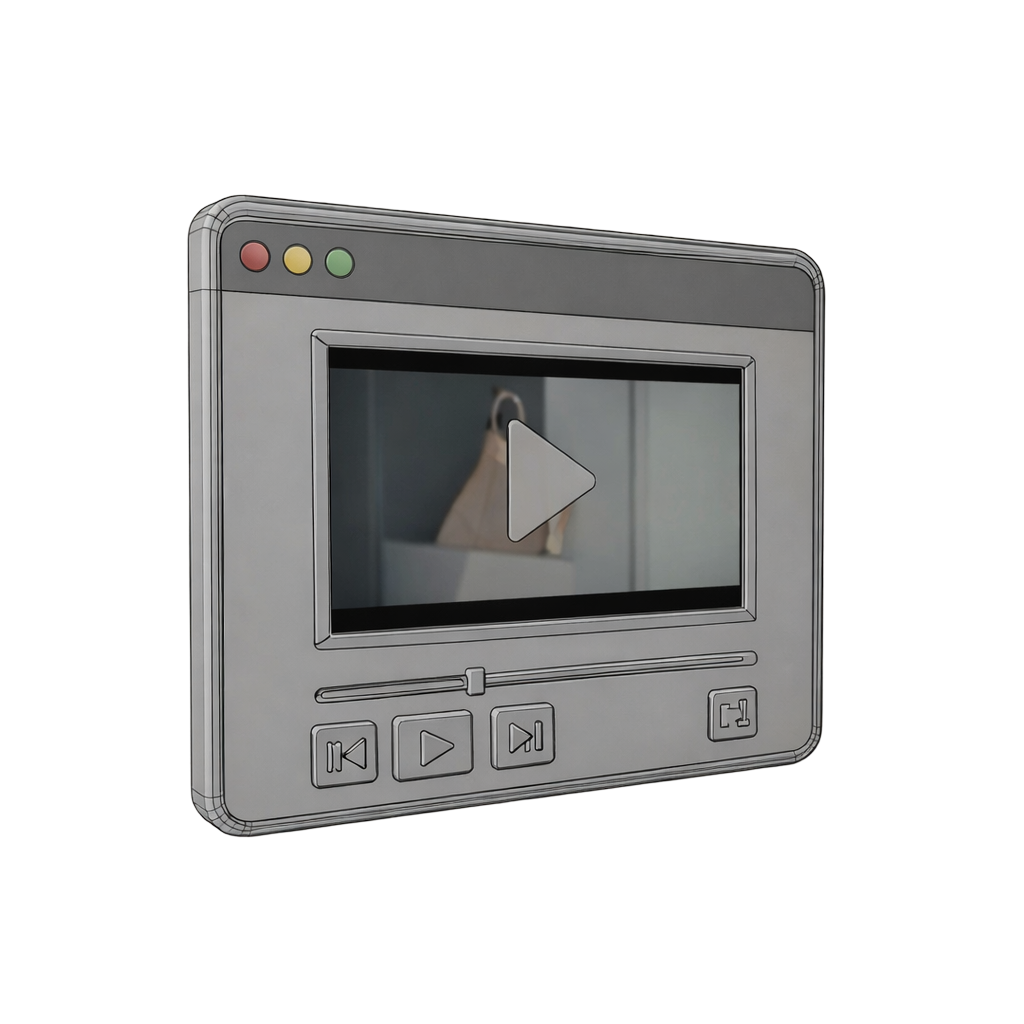
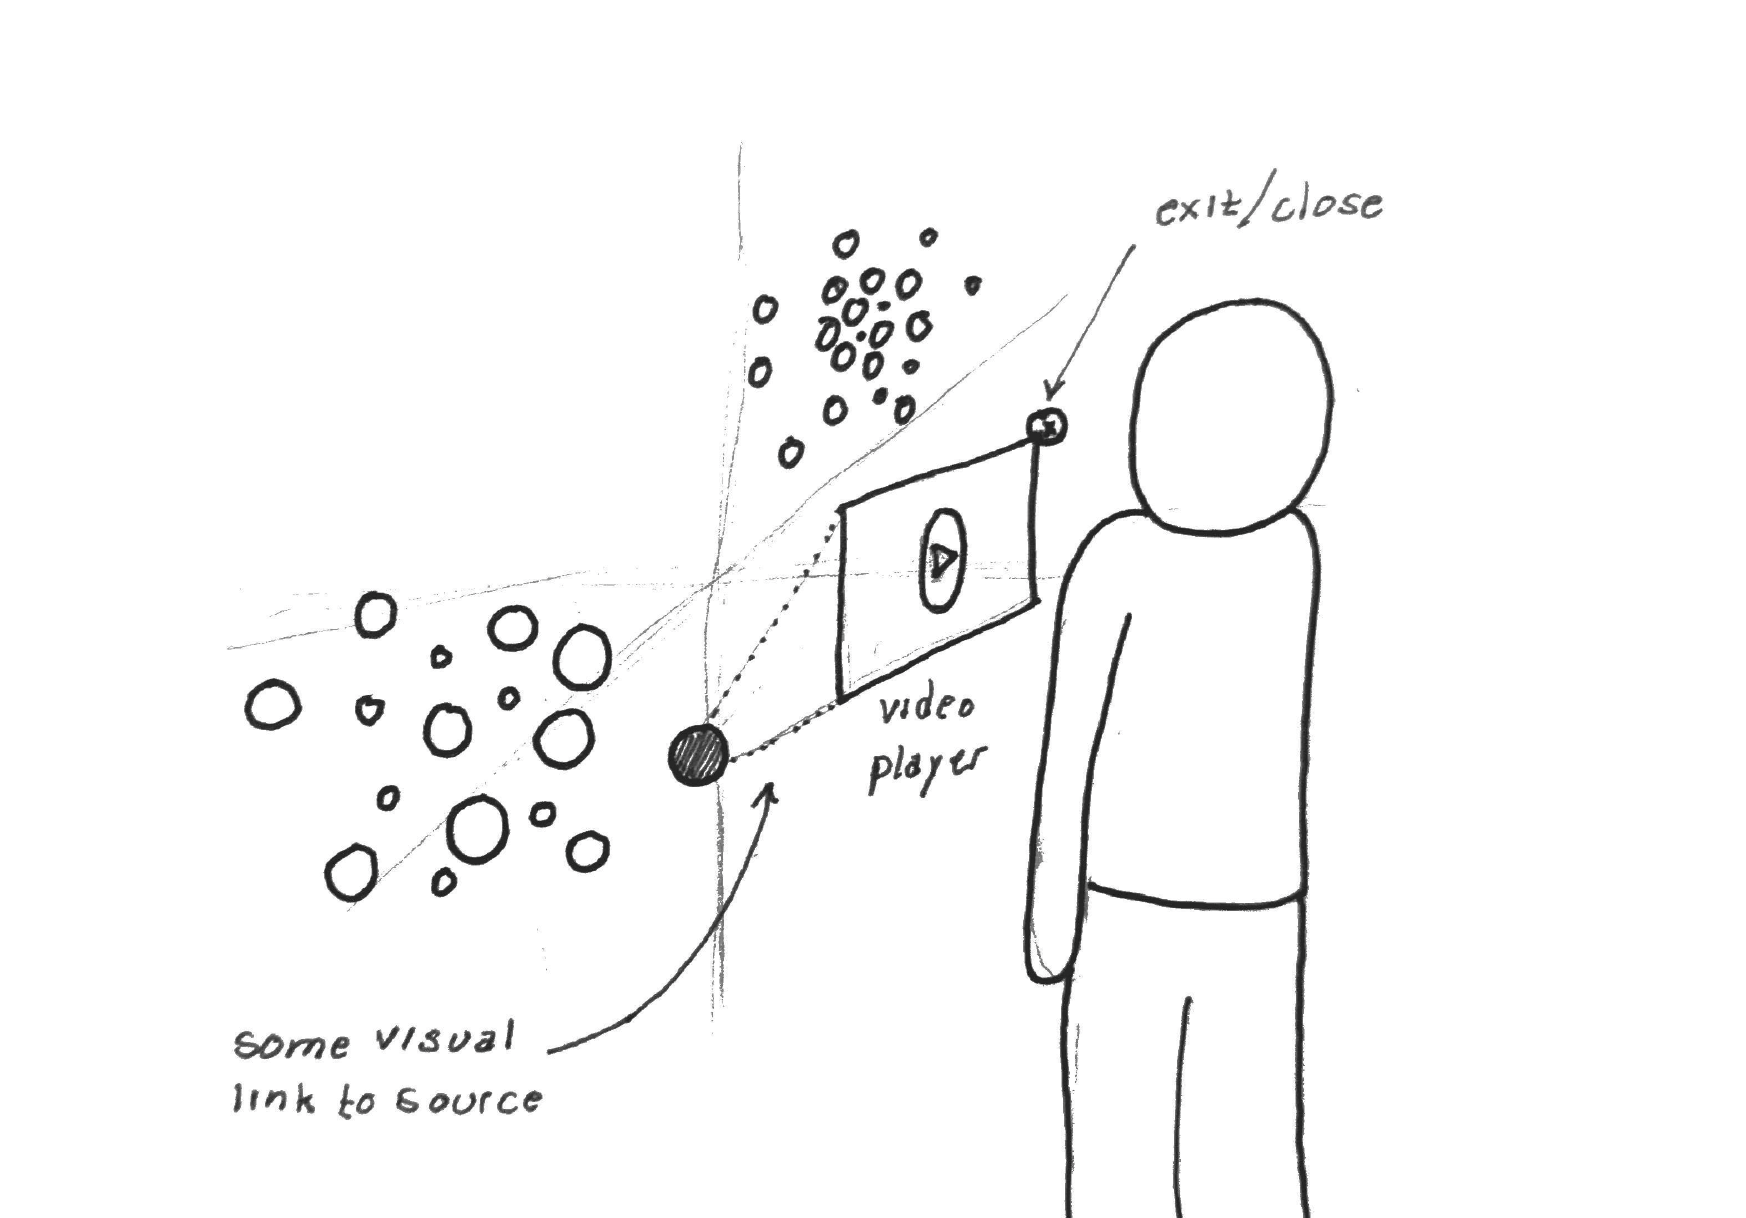
Unfortunately, the Enklu platform didn’t support embedded 3D videos.
Without getting into all the complexities of turning videos into material shaders and then syncing that up with the audio again, it was more strategic for me to adjust the experience to just use audio-only clips than force the video format.
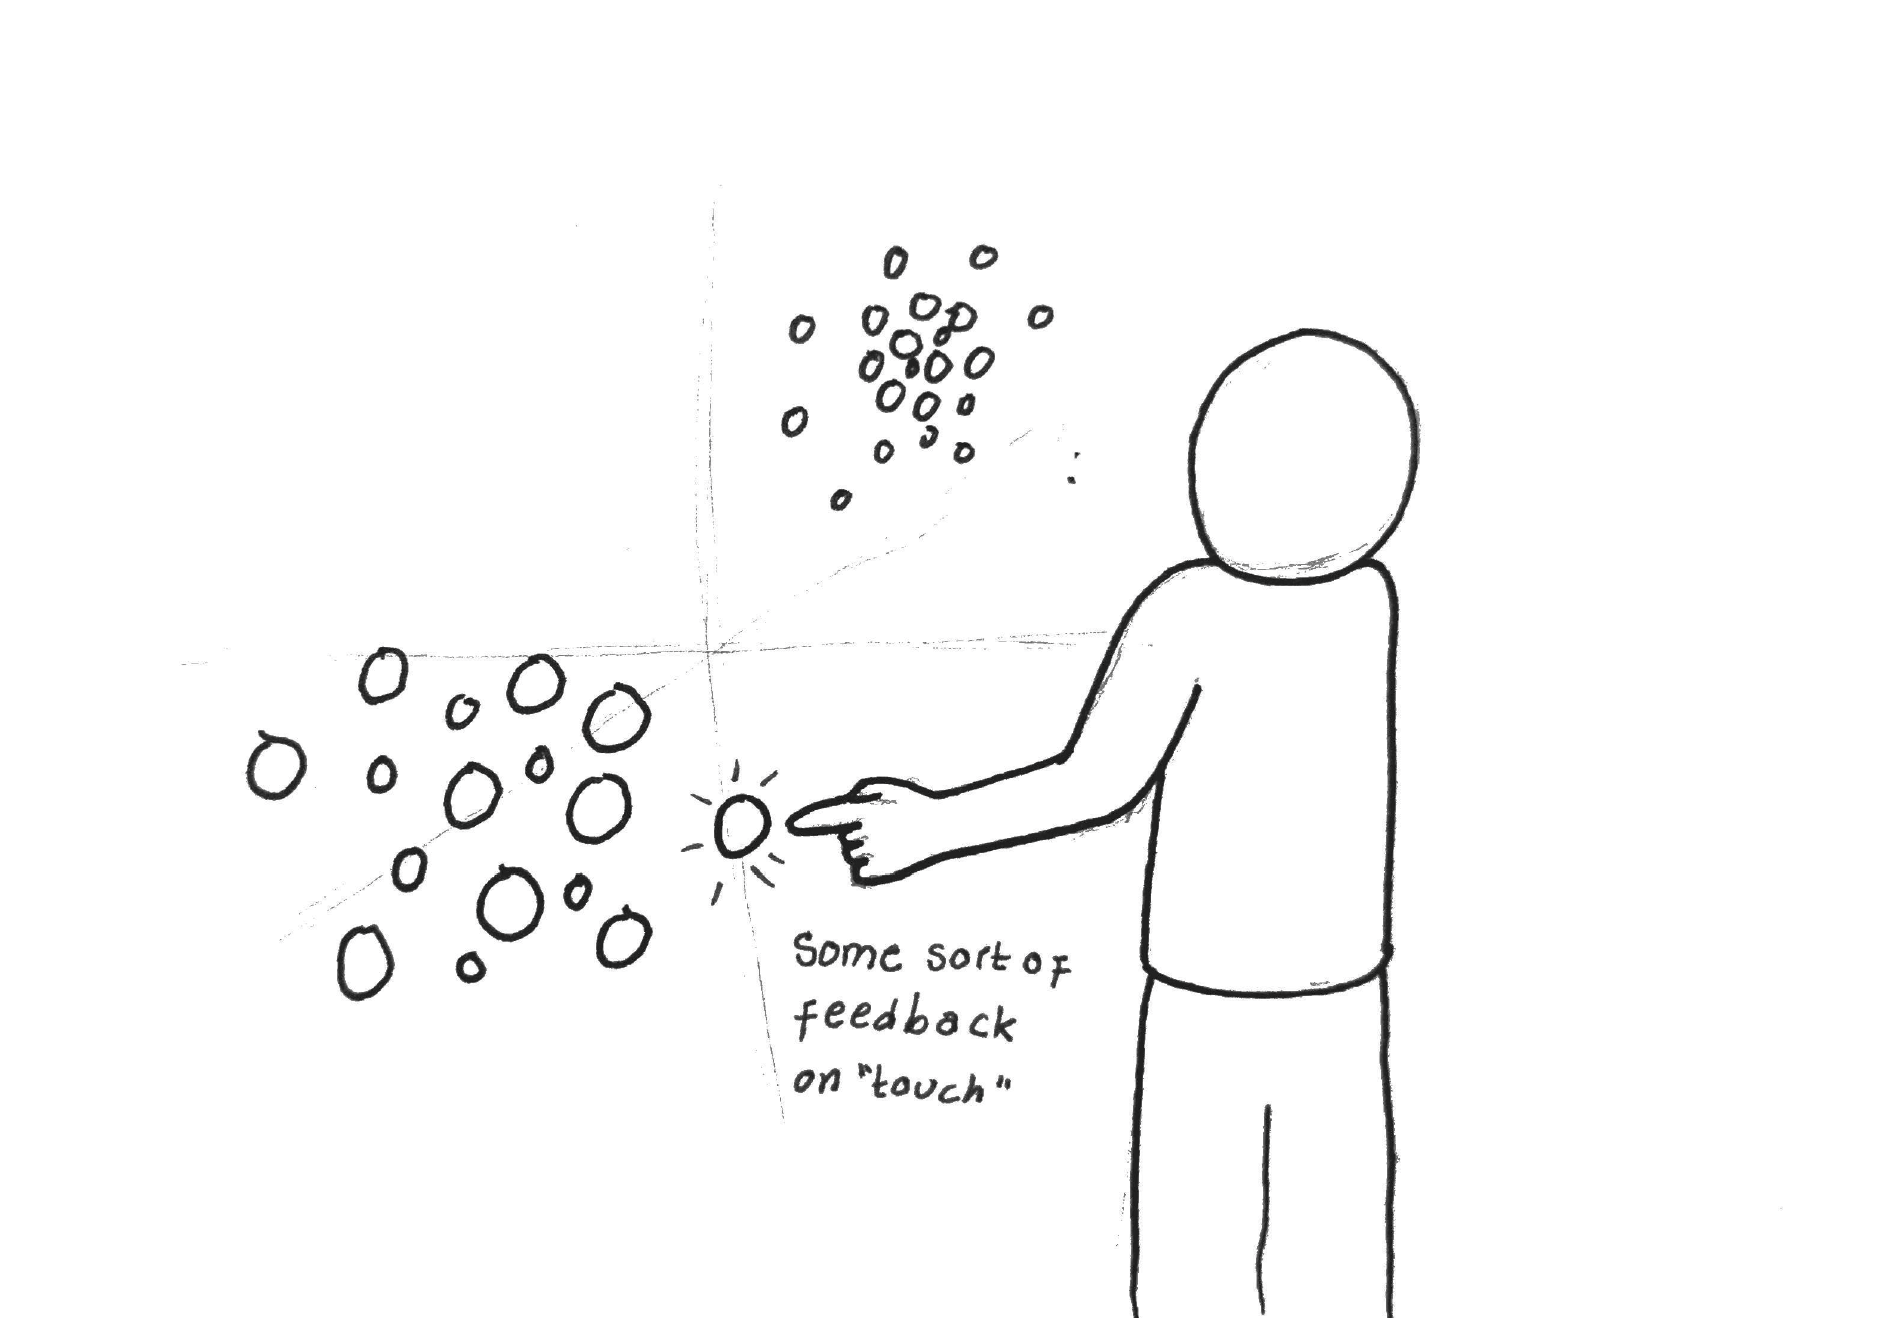
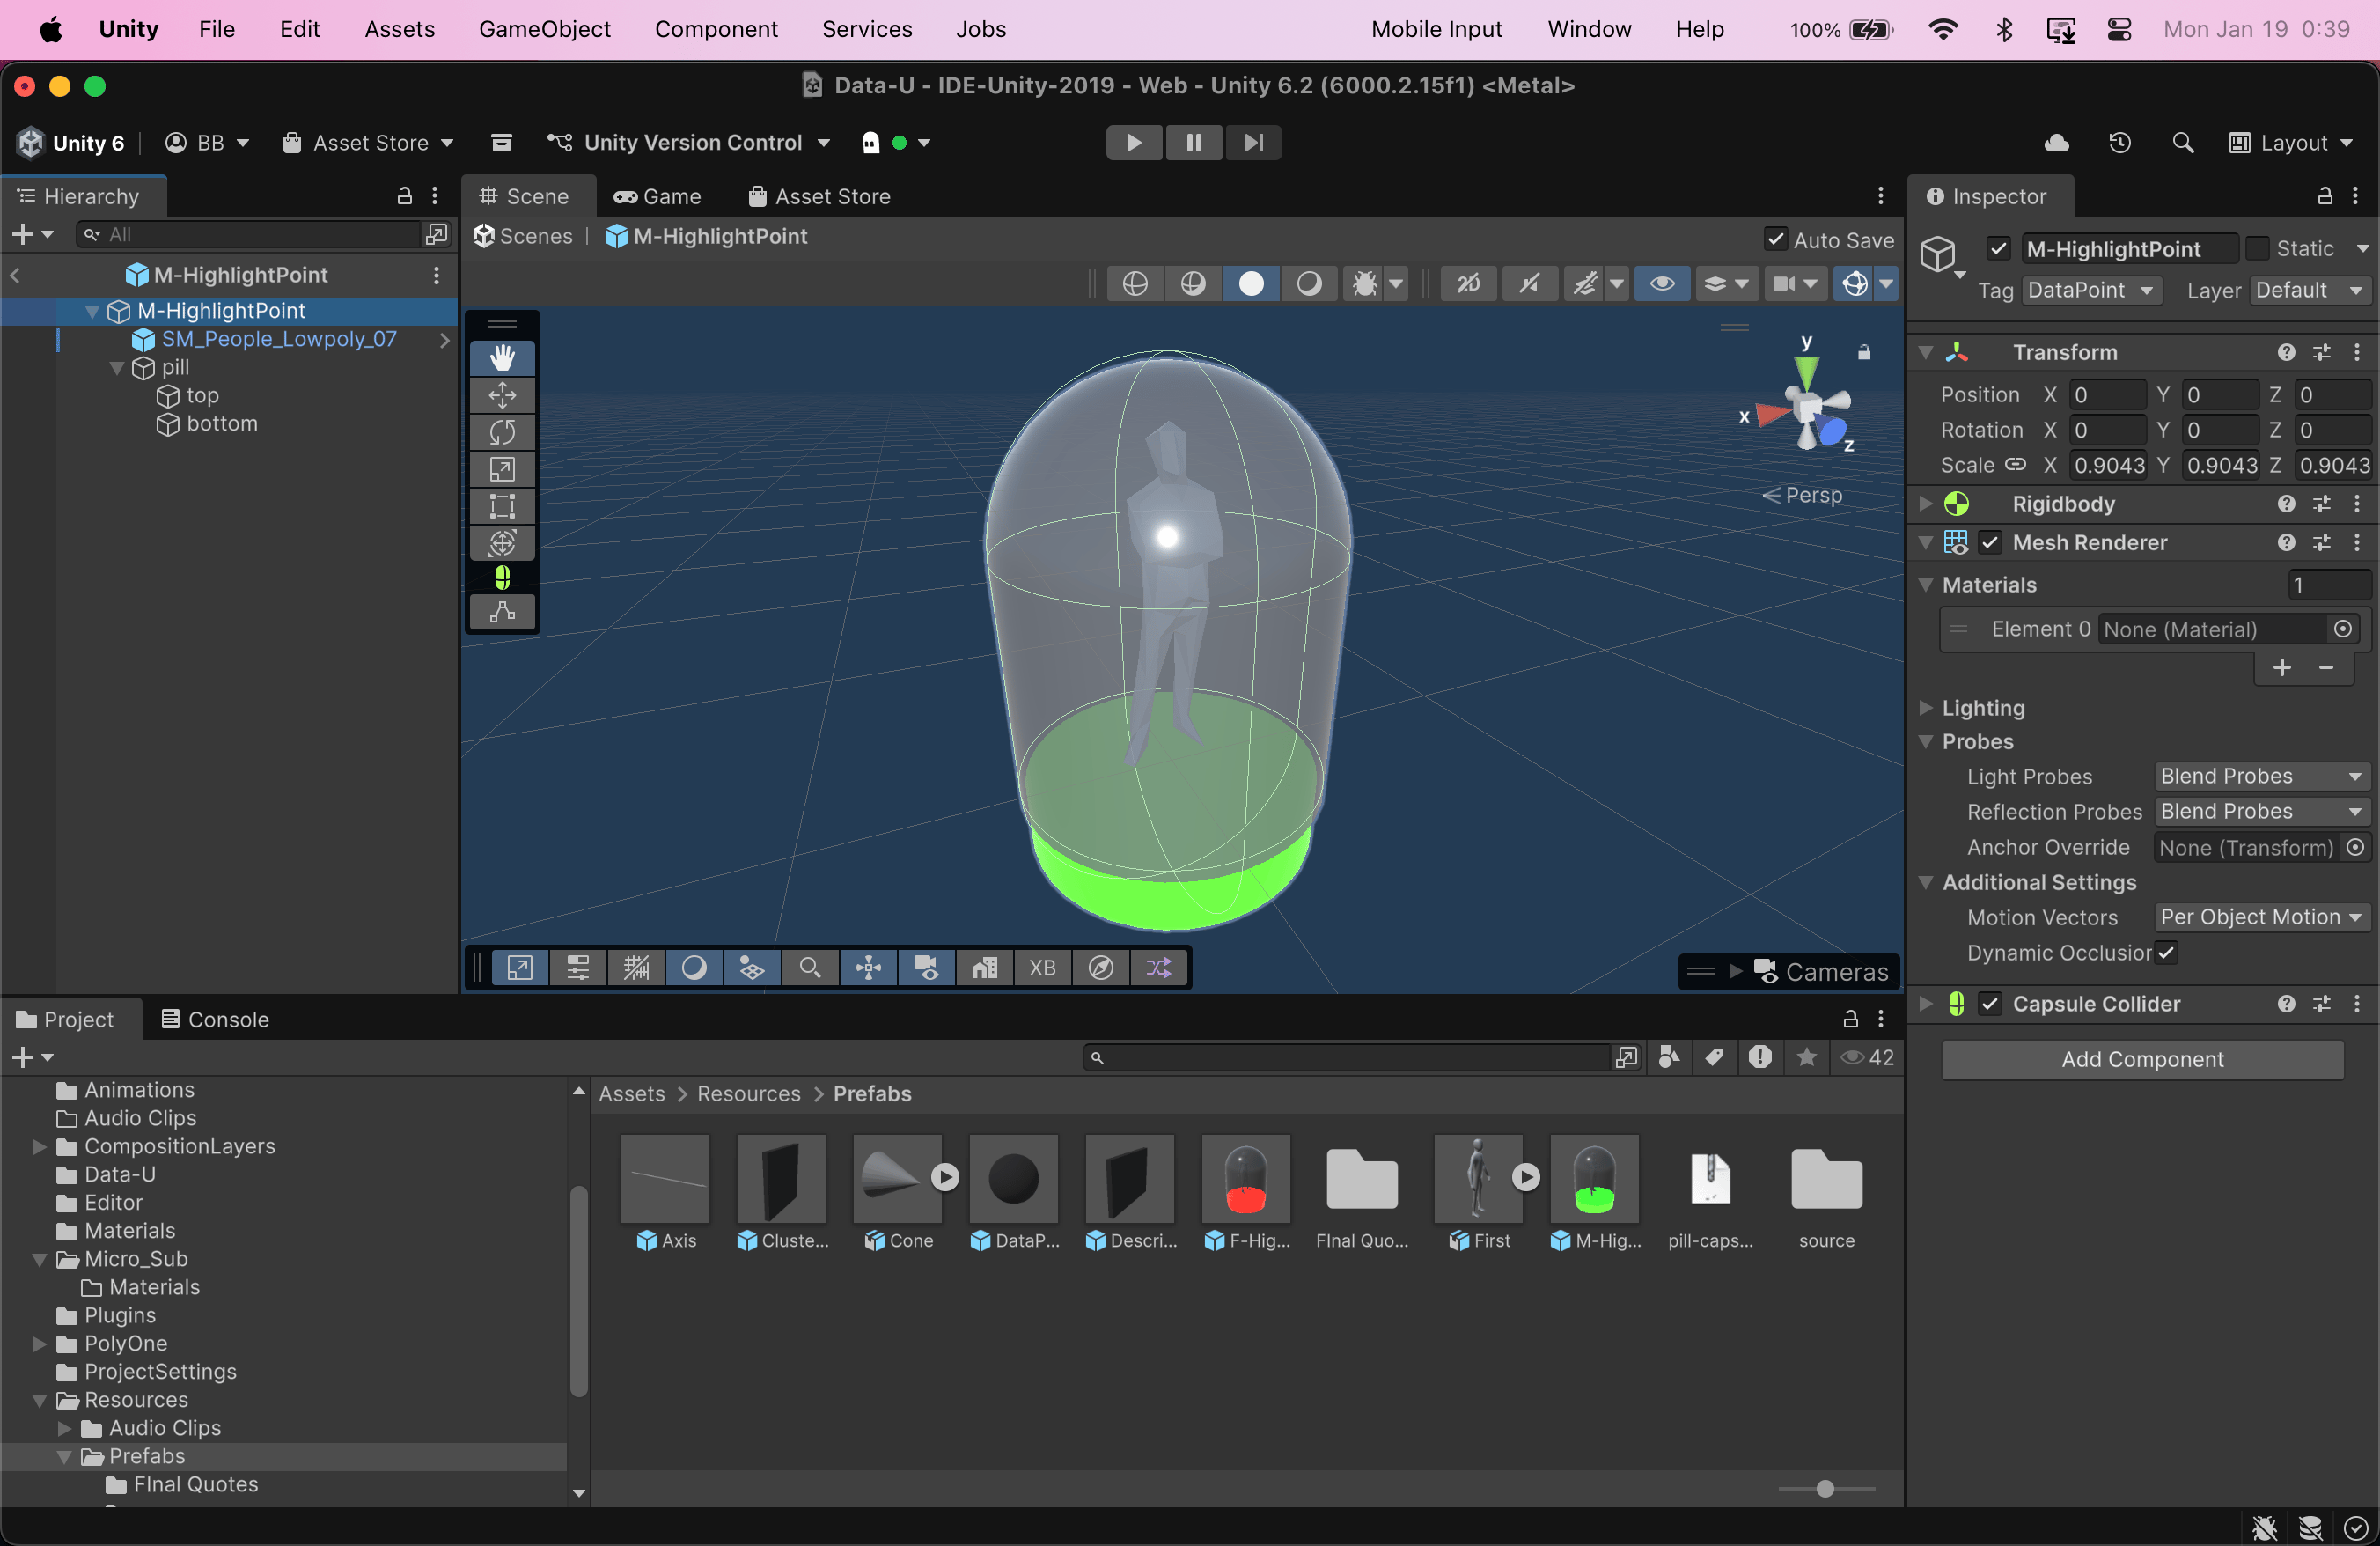
Later I took this constraint into account when creating objects for the interview datapoints. Without video there was no visual representation of the people behind the interviews, leading me to the idea of creating little “people” instead that were on display inside of capsules and would speak to you when you opened them up.
Moving from prototyping on a computer screen to prototyping in mixed reality with Hololens, the focus naturally shifted towards the scale and human factors of the experience.
- What scale should the whole scene/environment/experience be?
- What scale should individual datapoints be?
- How does a person’s height affect sight lines and interactions for the experience?
- How should text labels, signage, and user instructions be presented in 3D to remain legible?
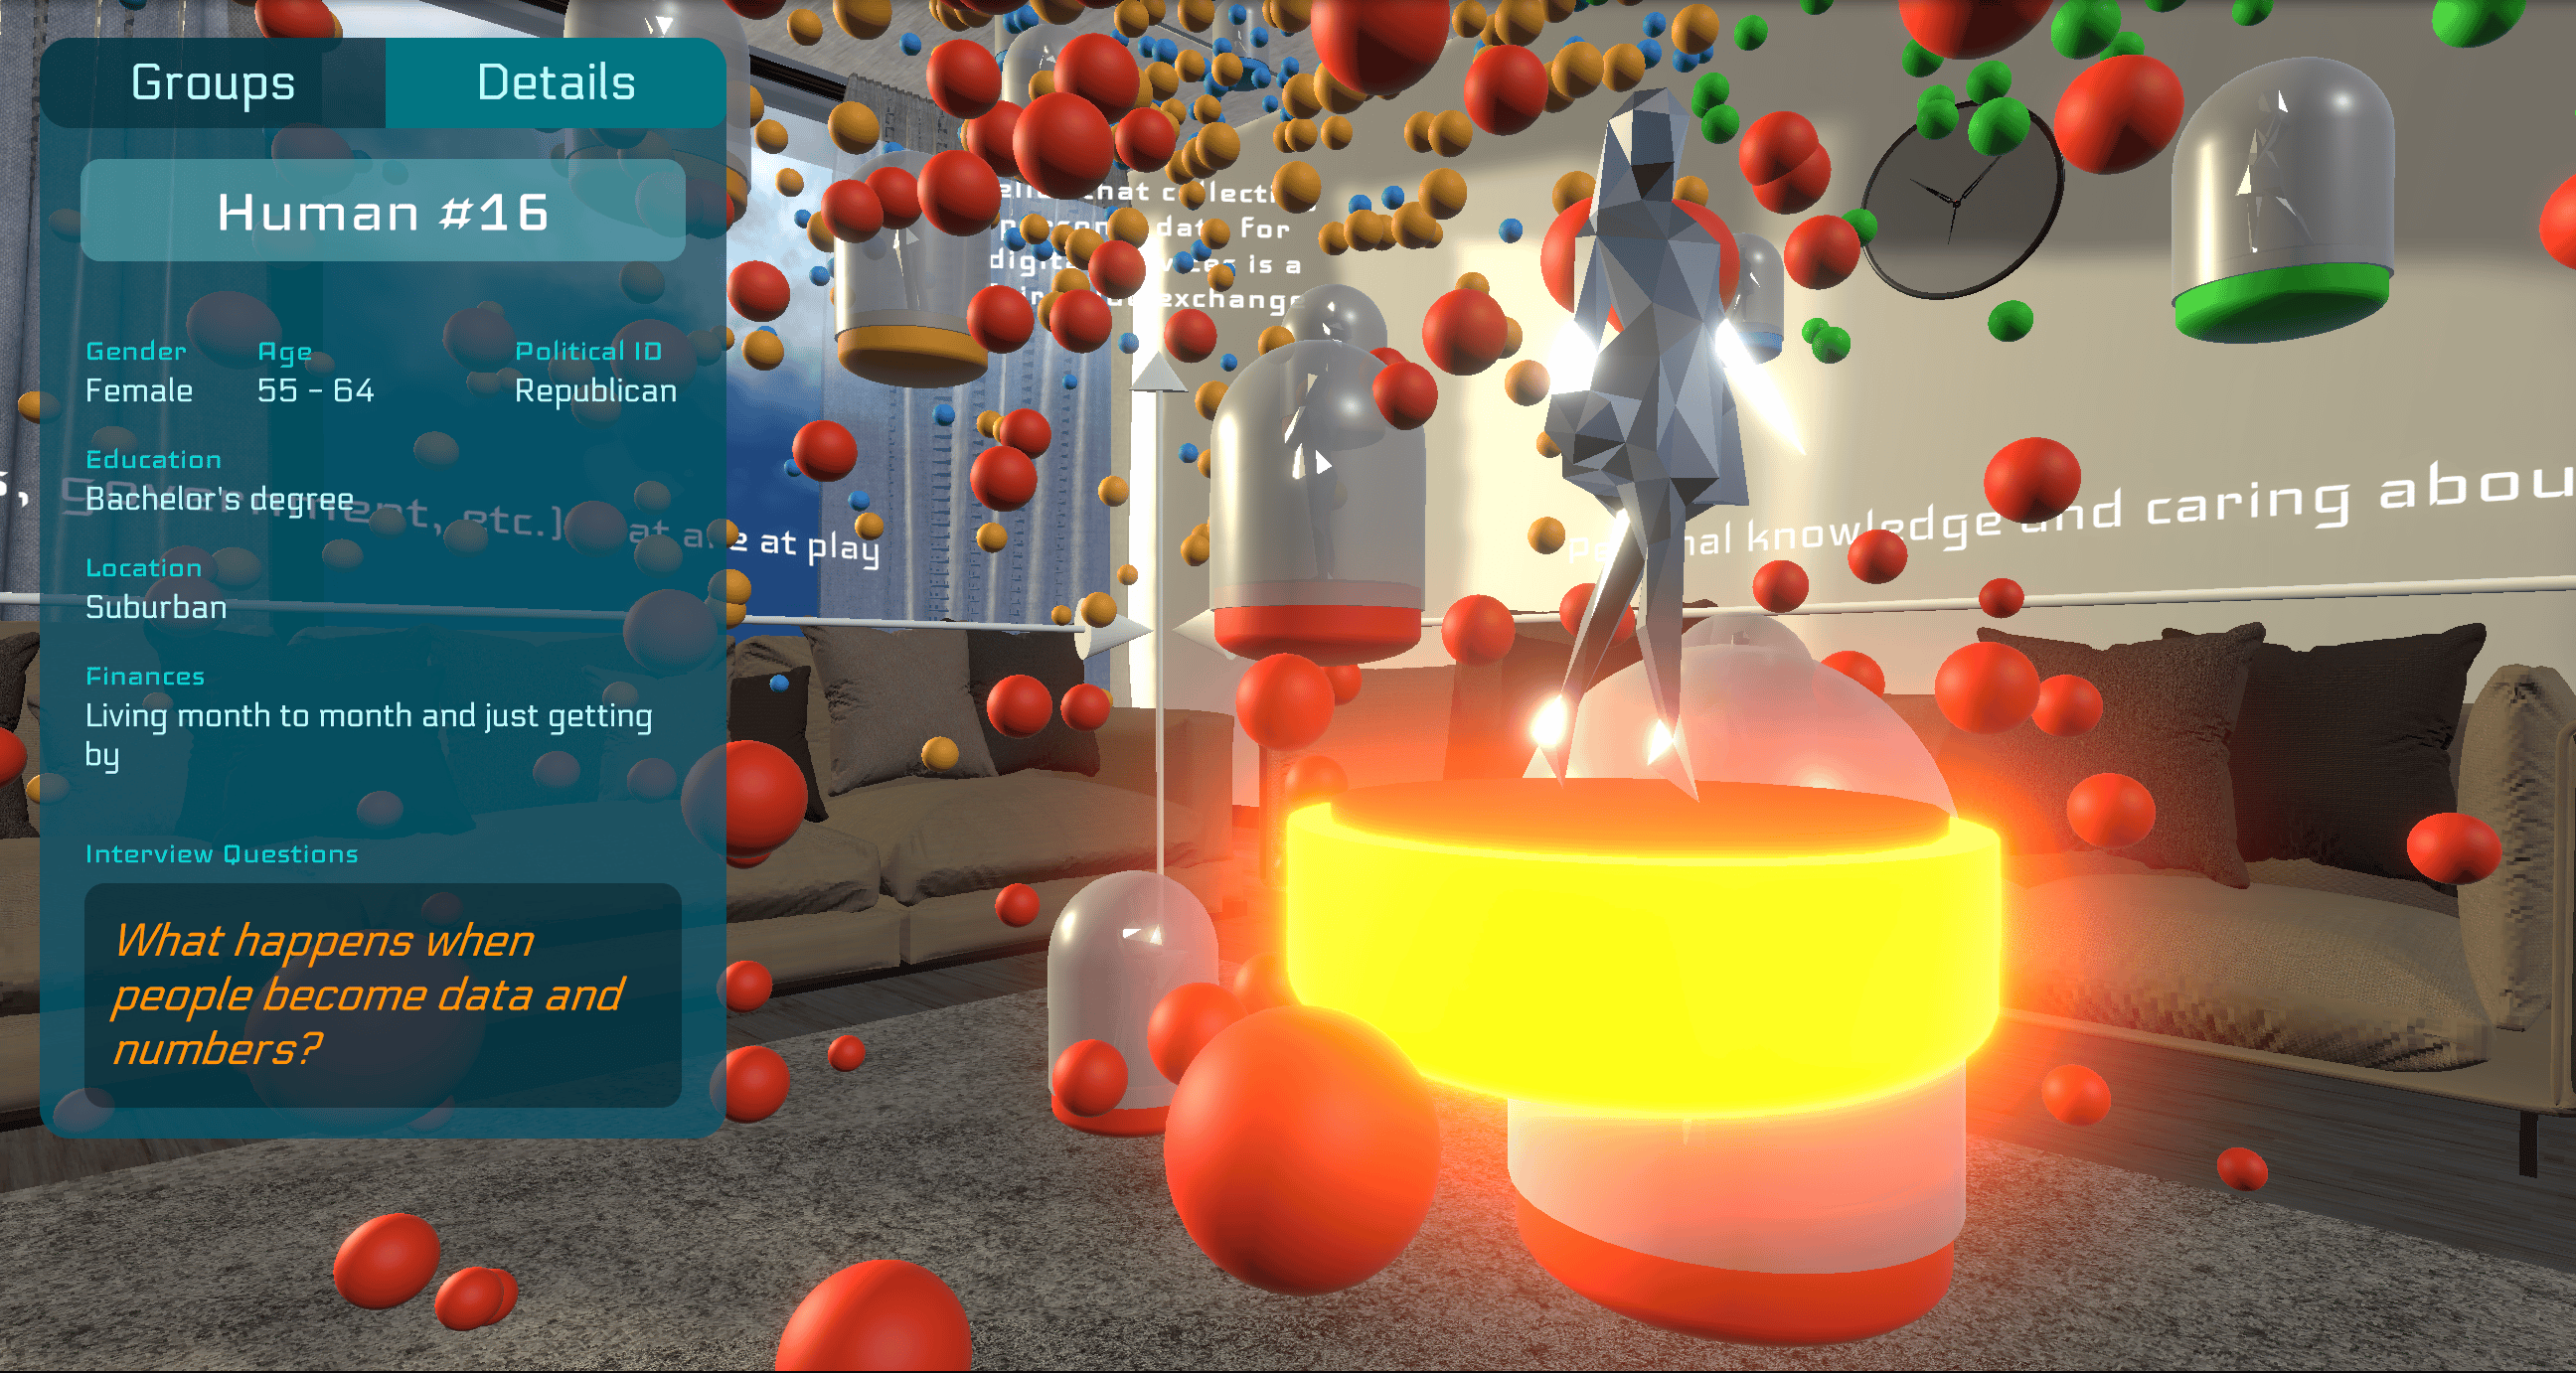
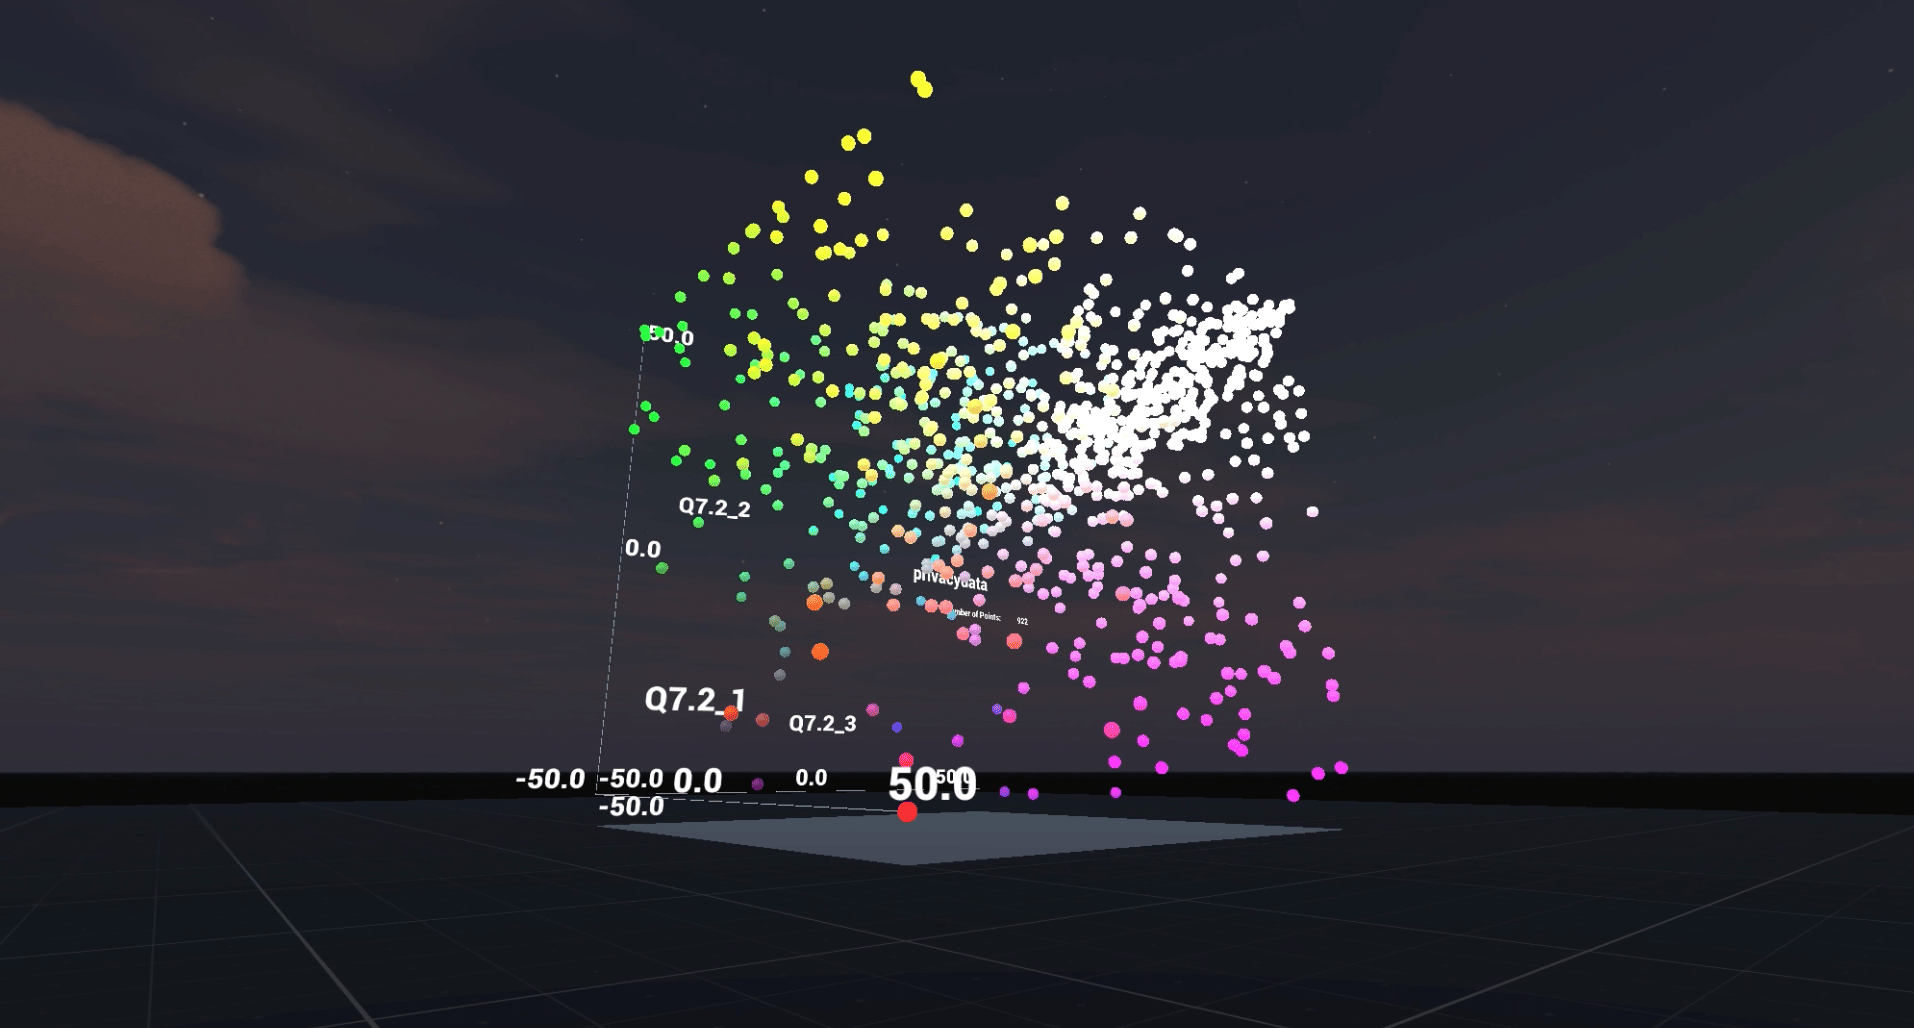
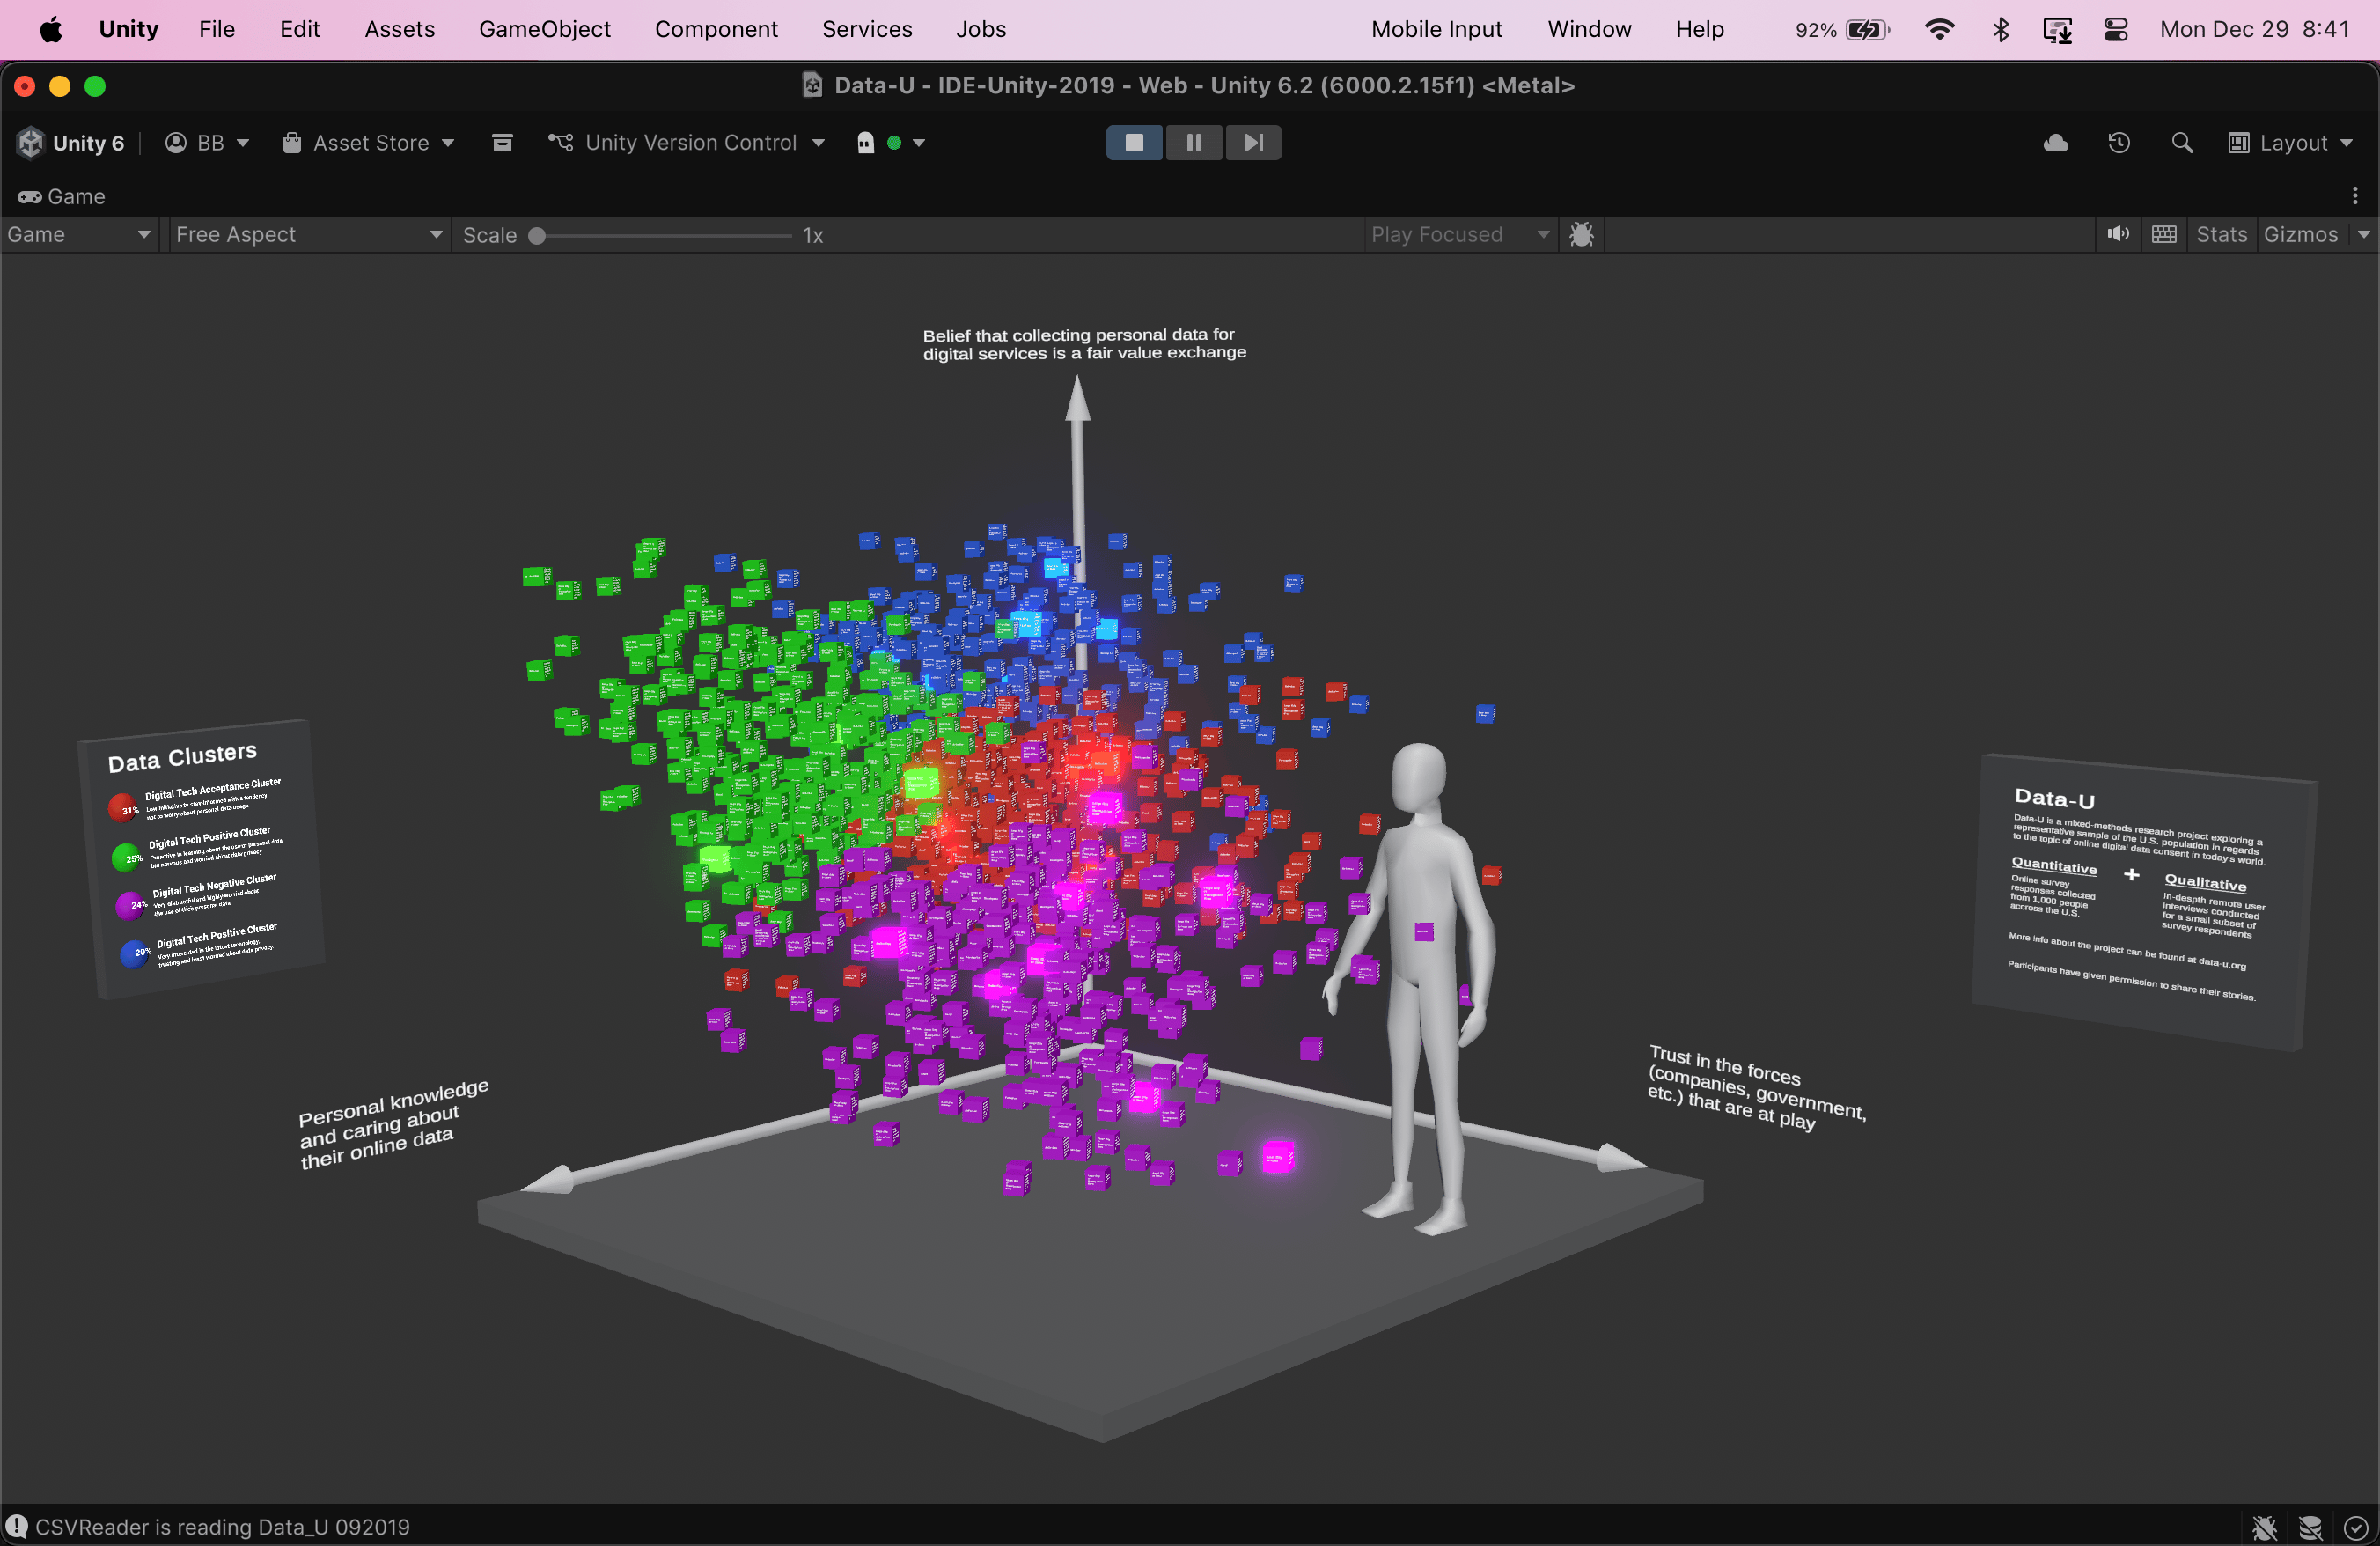
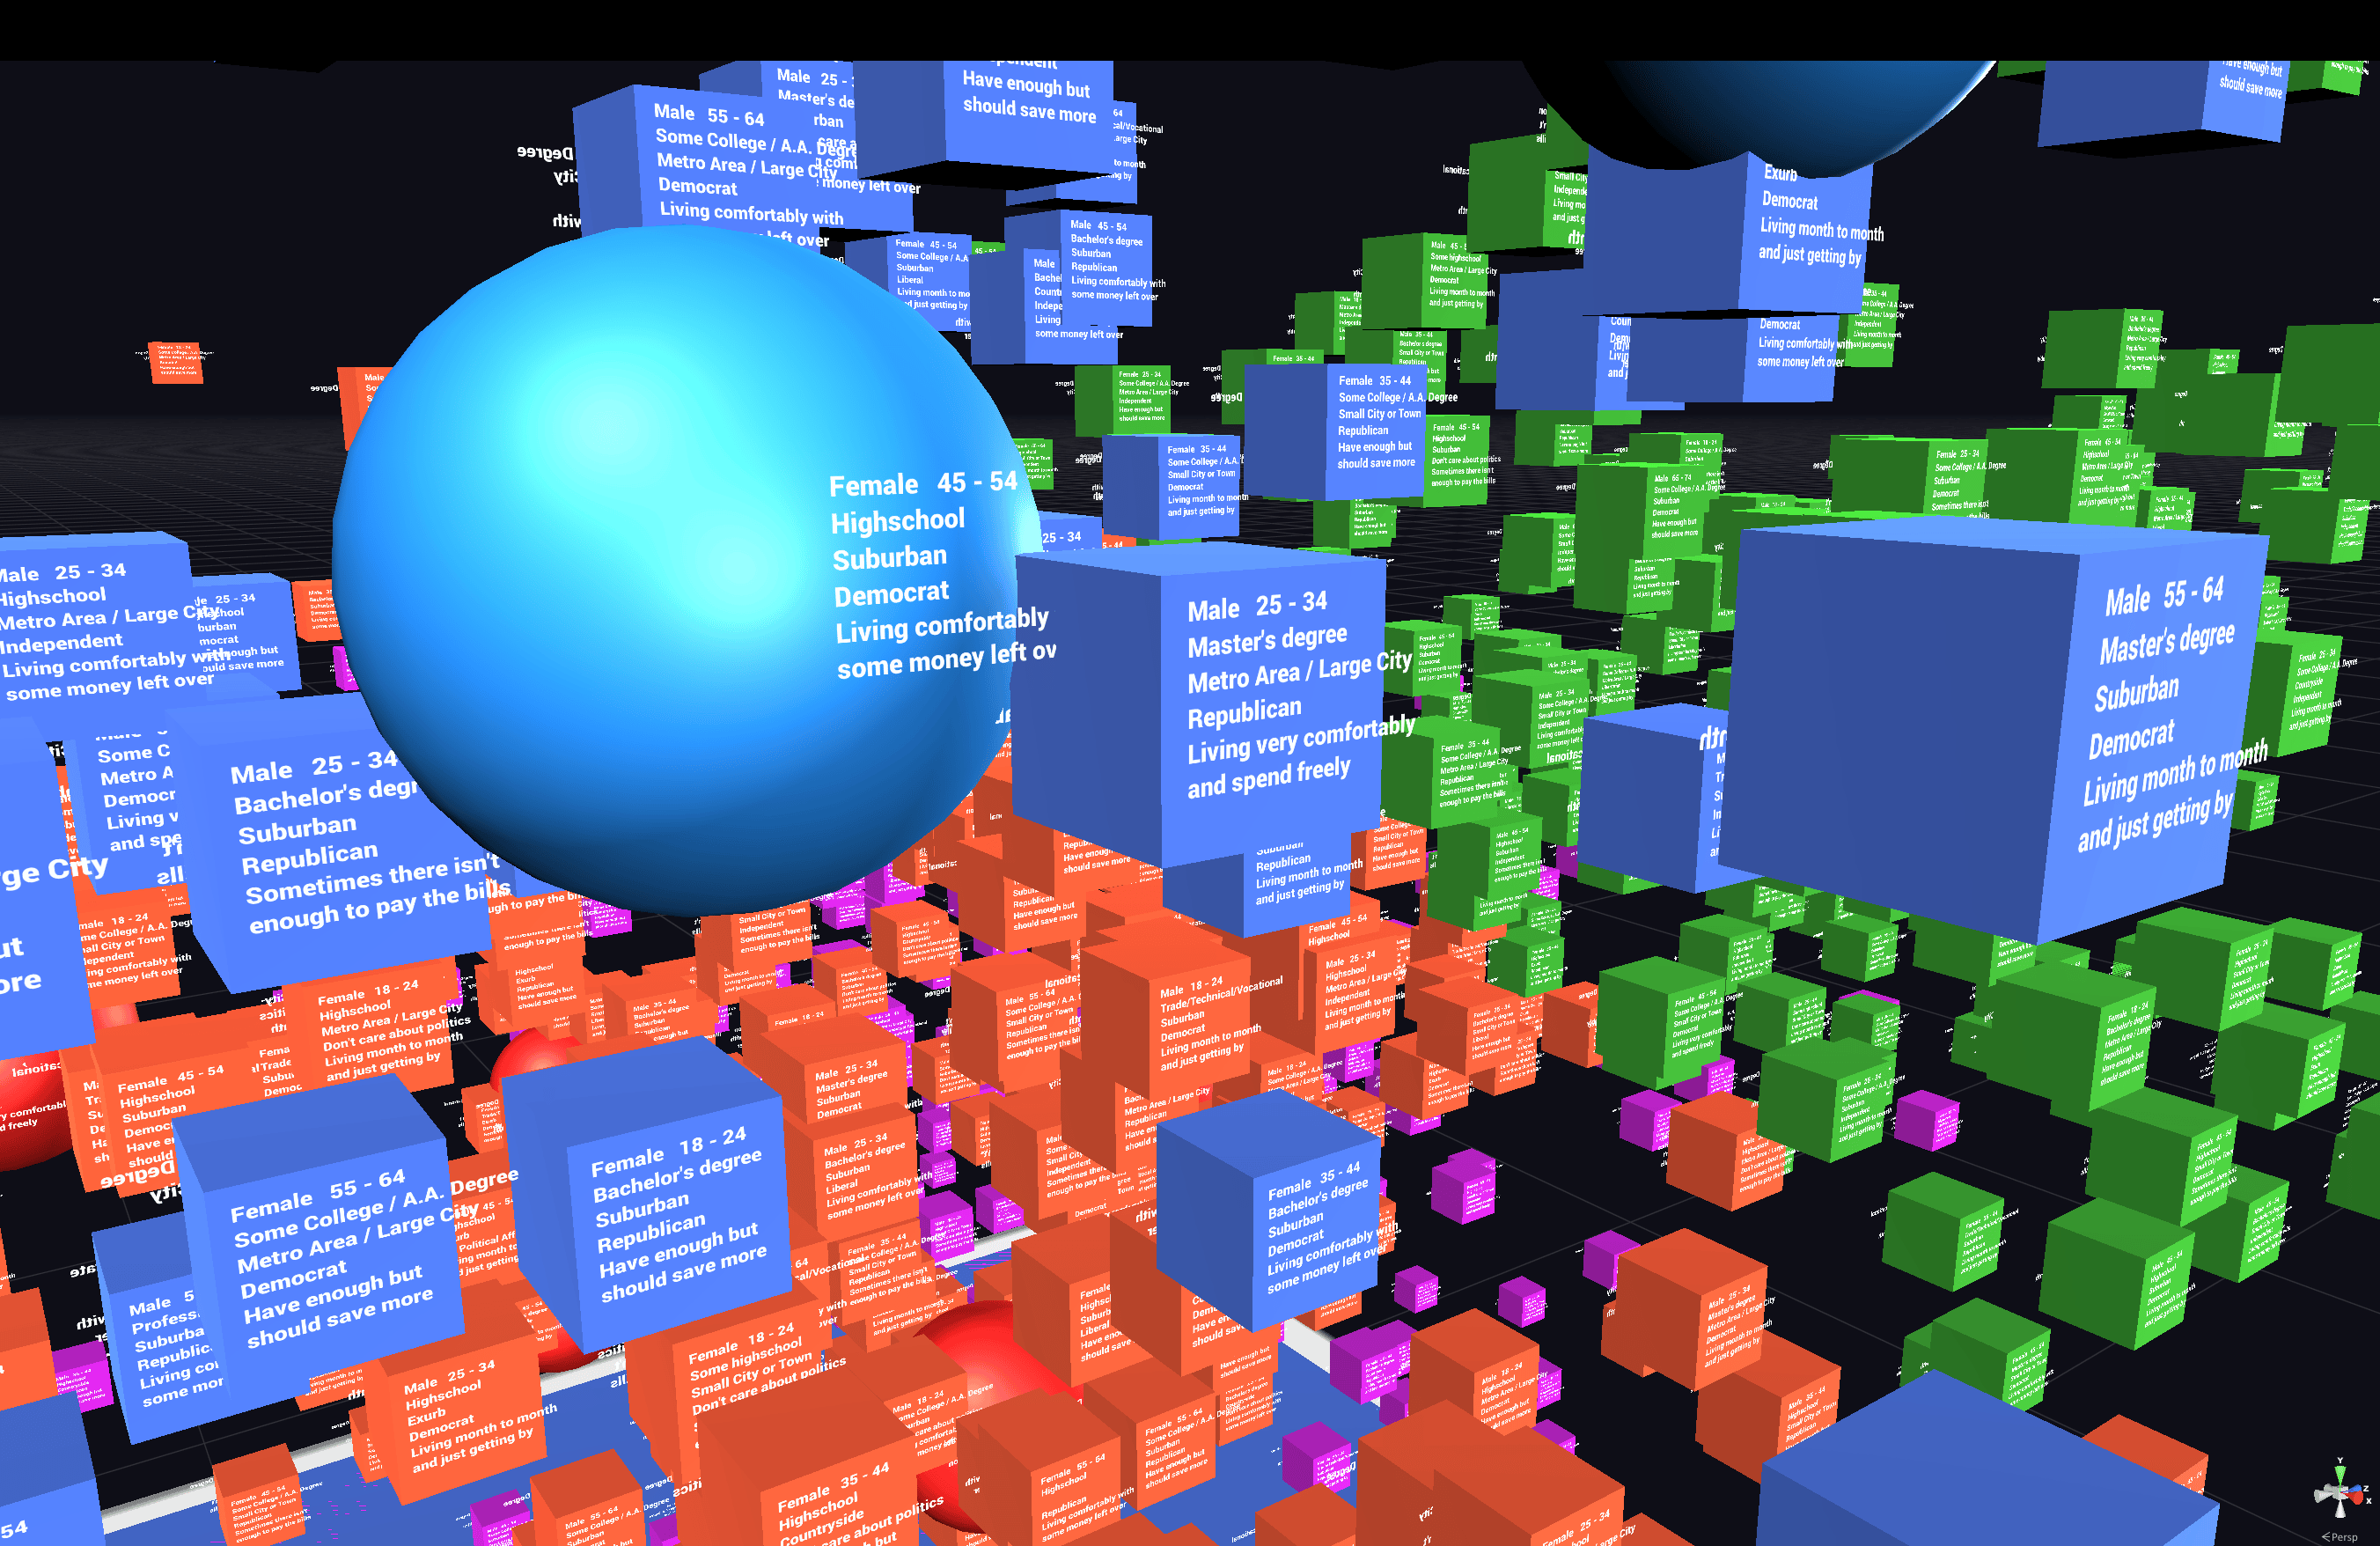
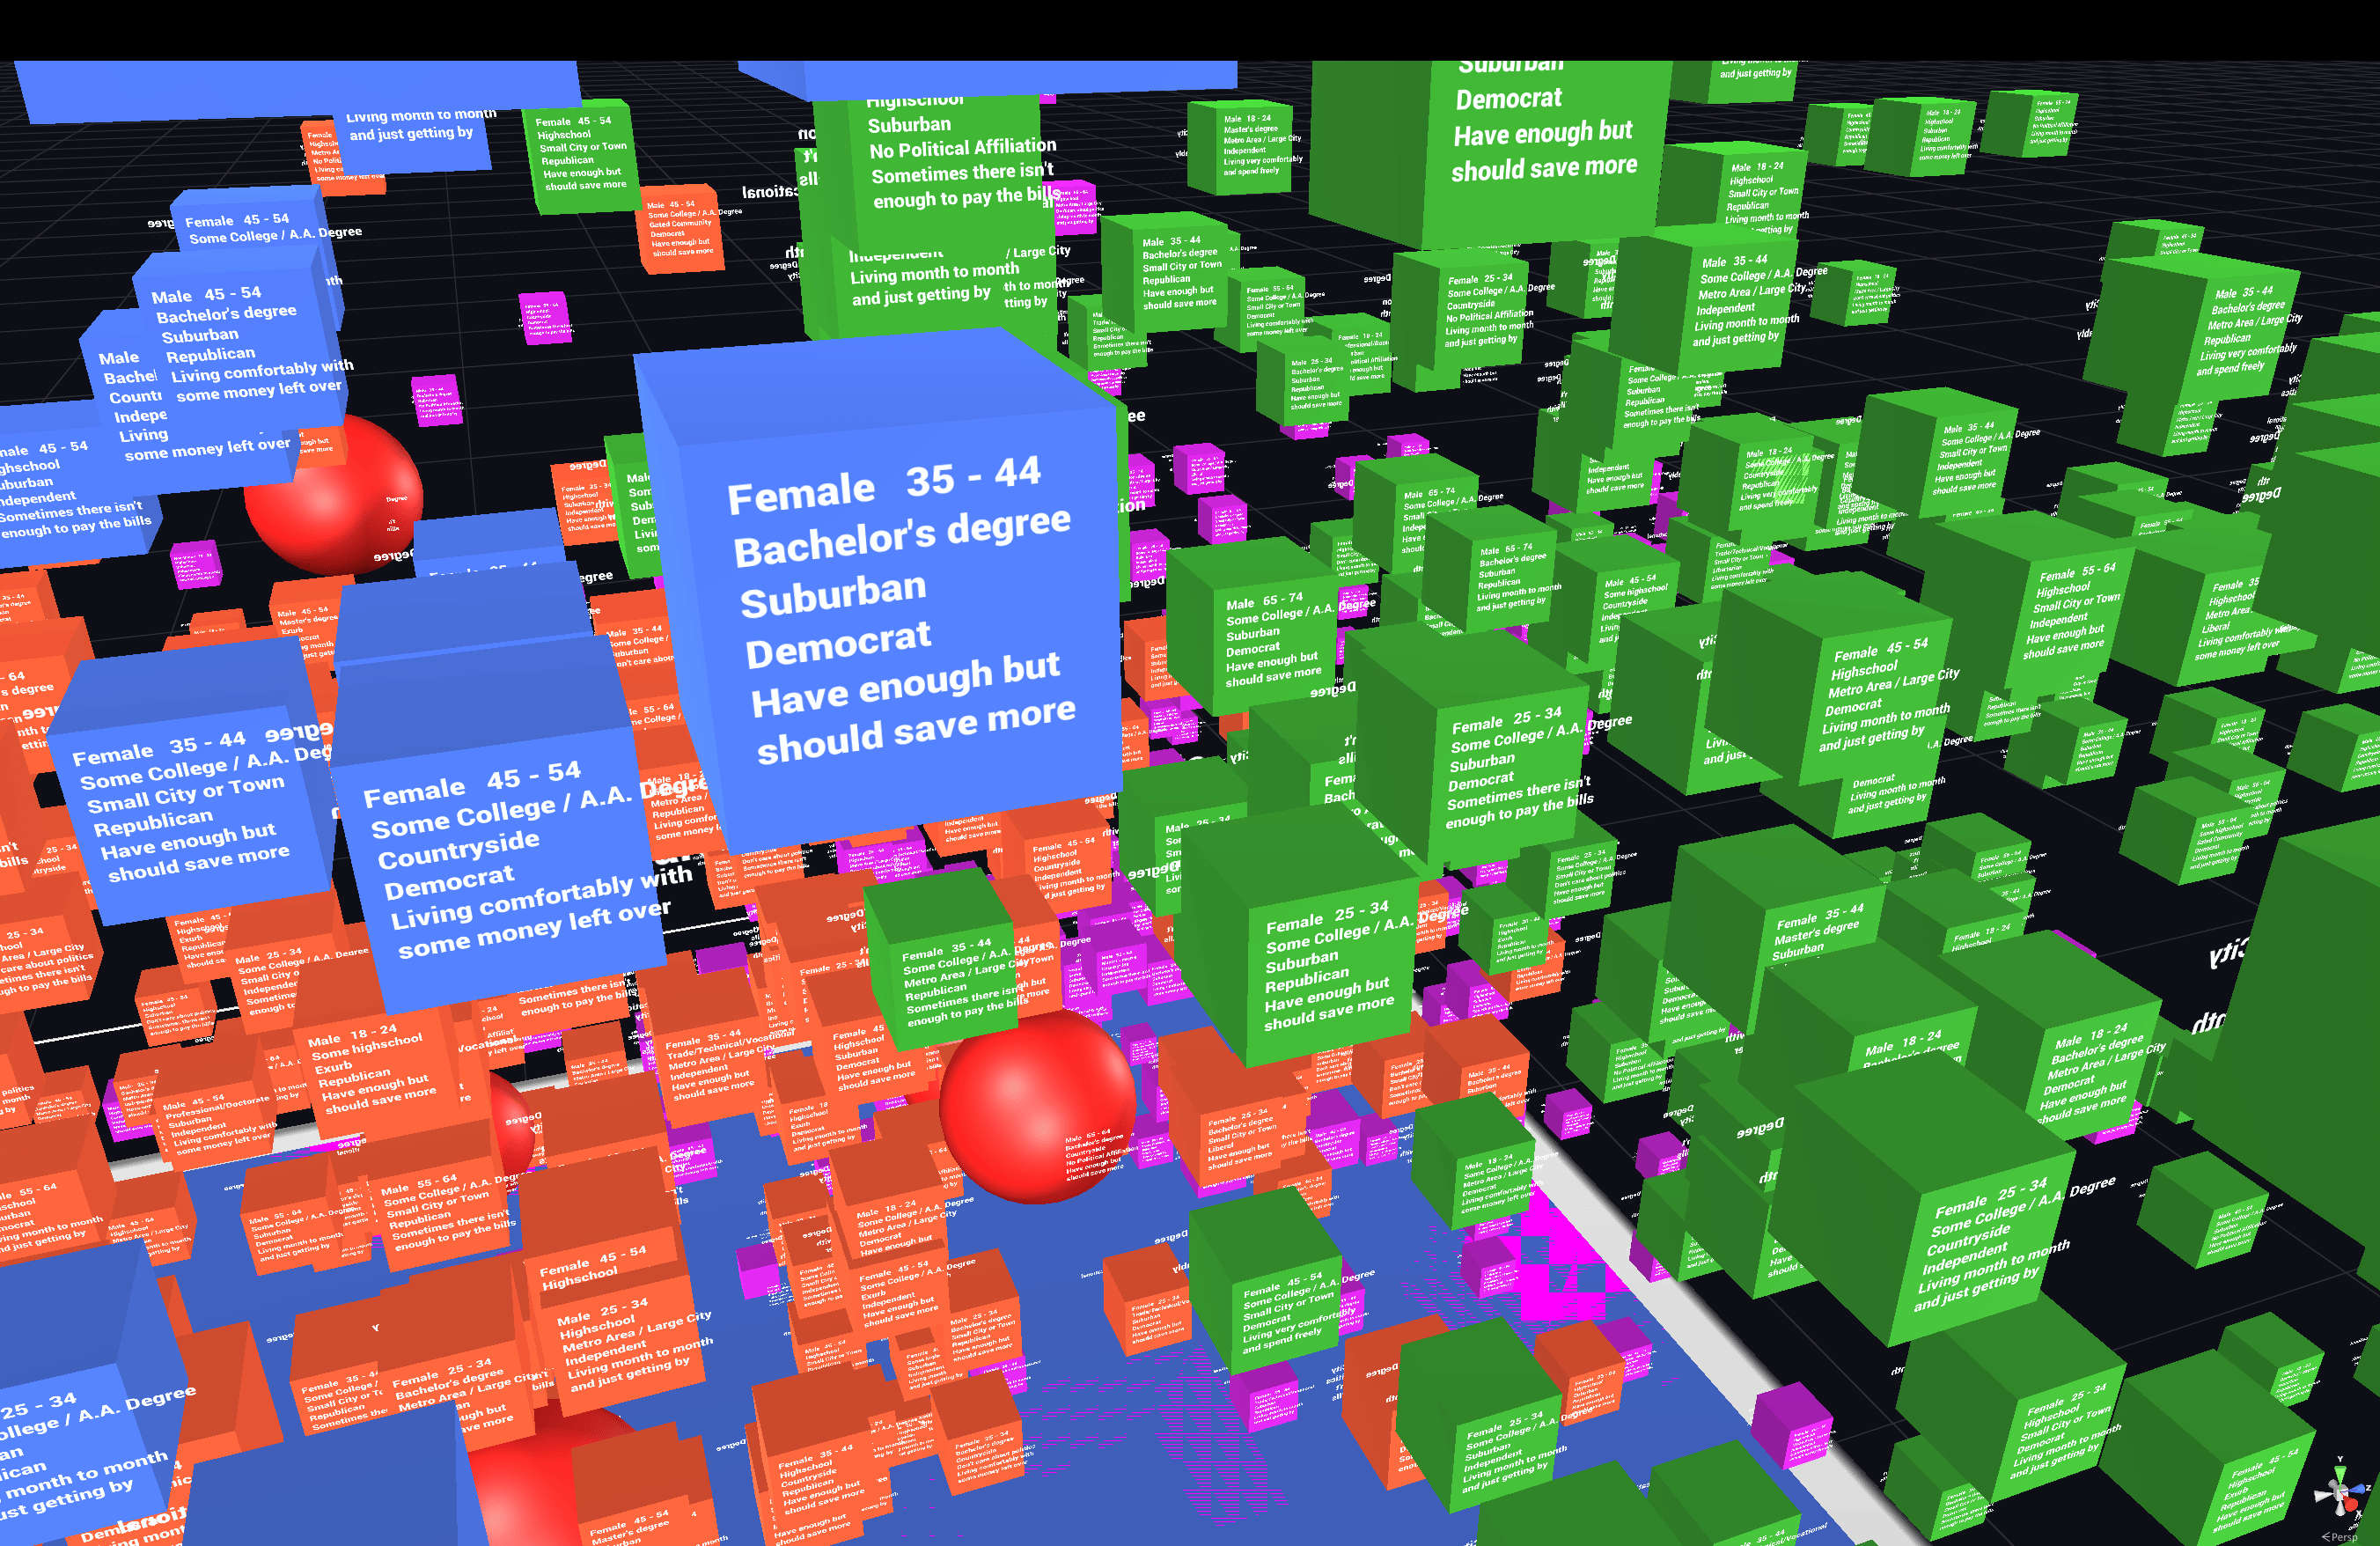
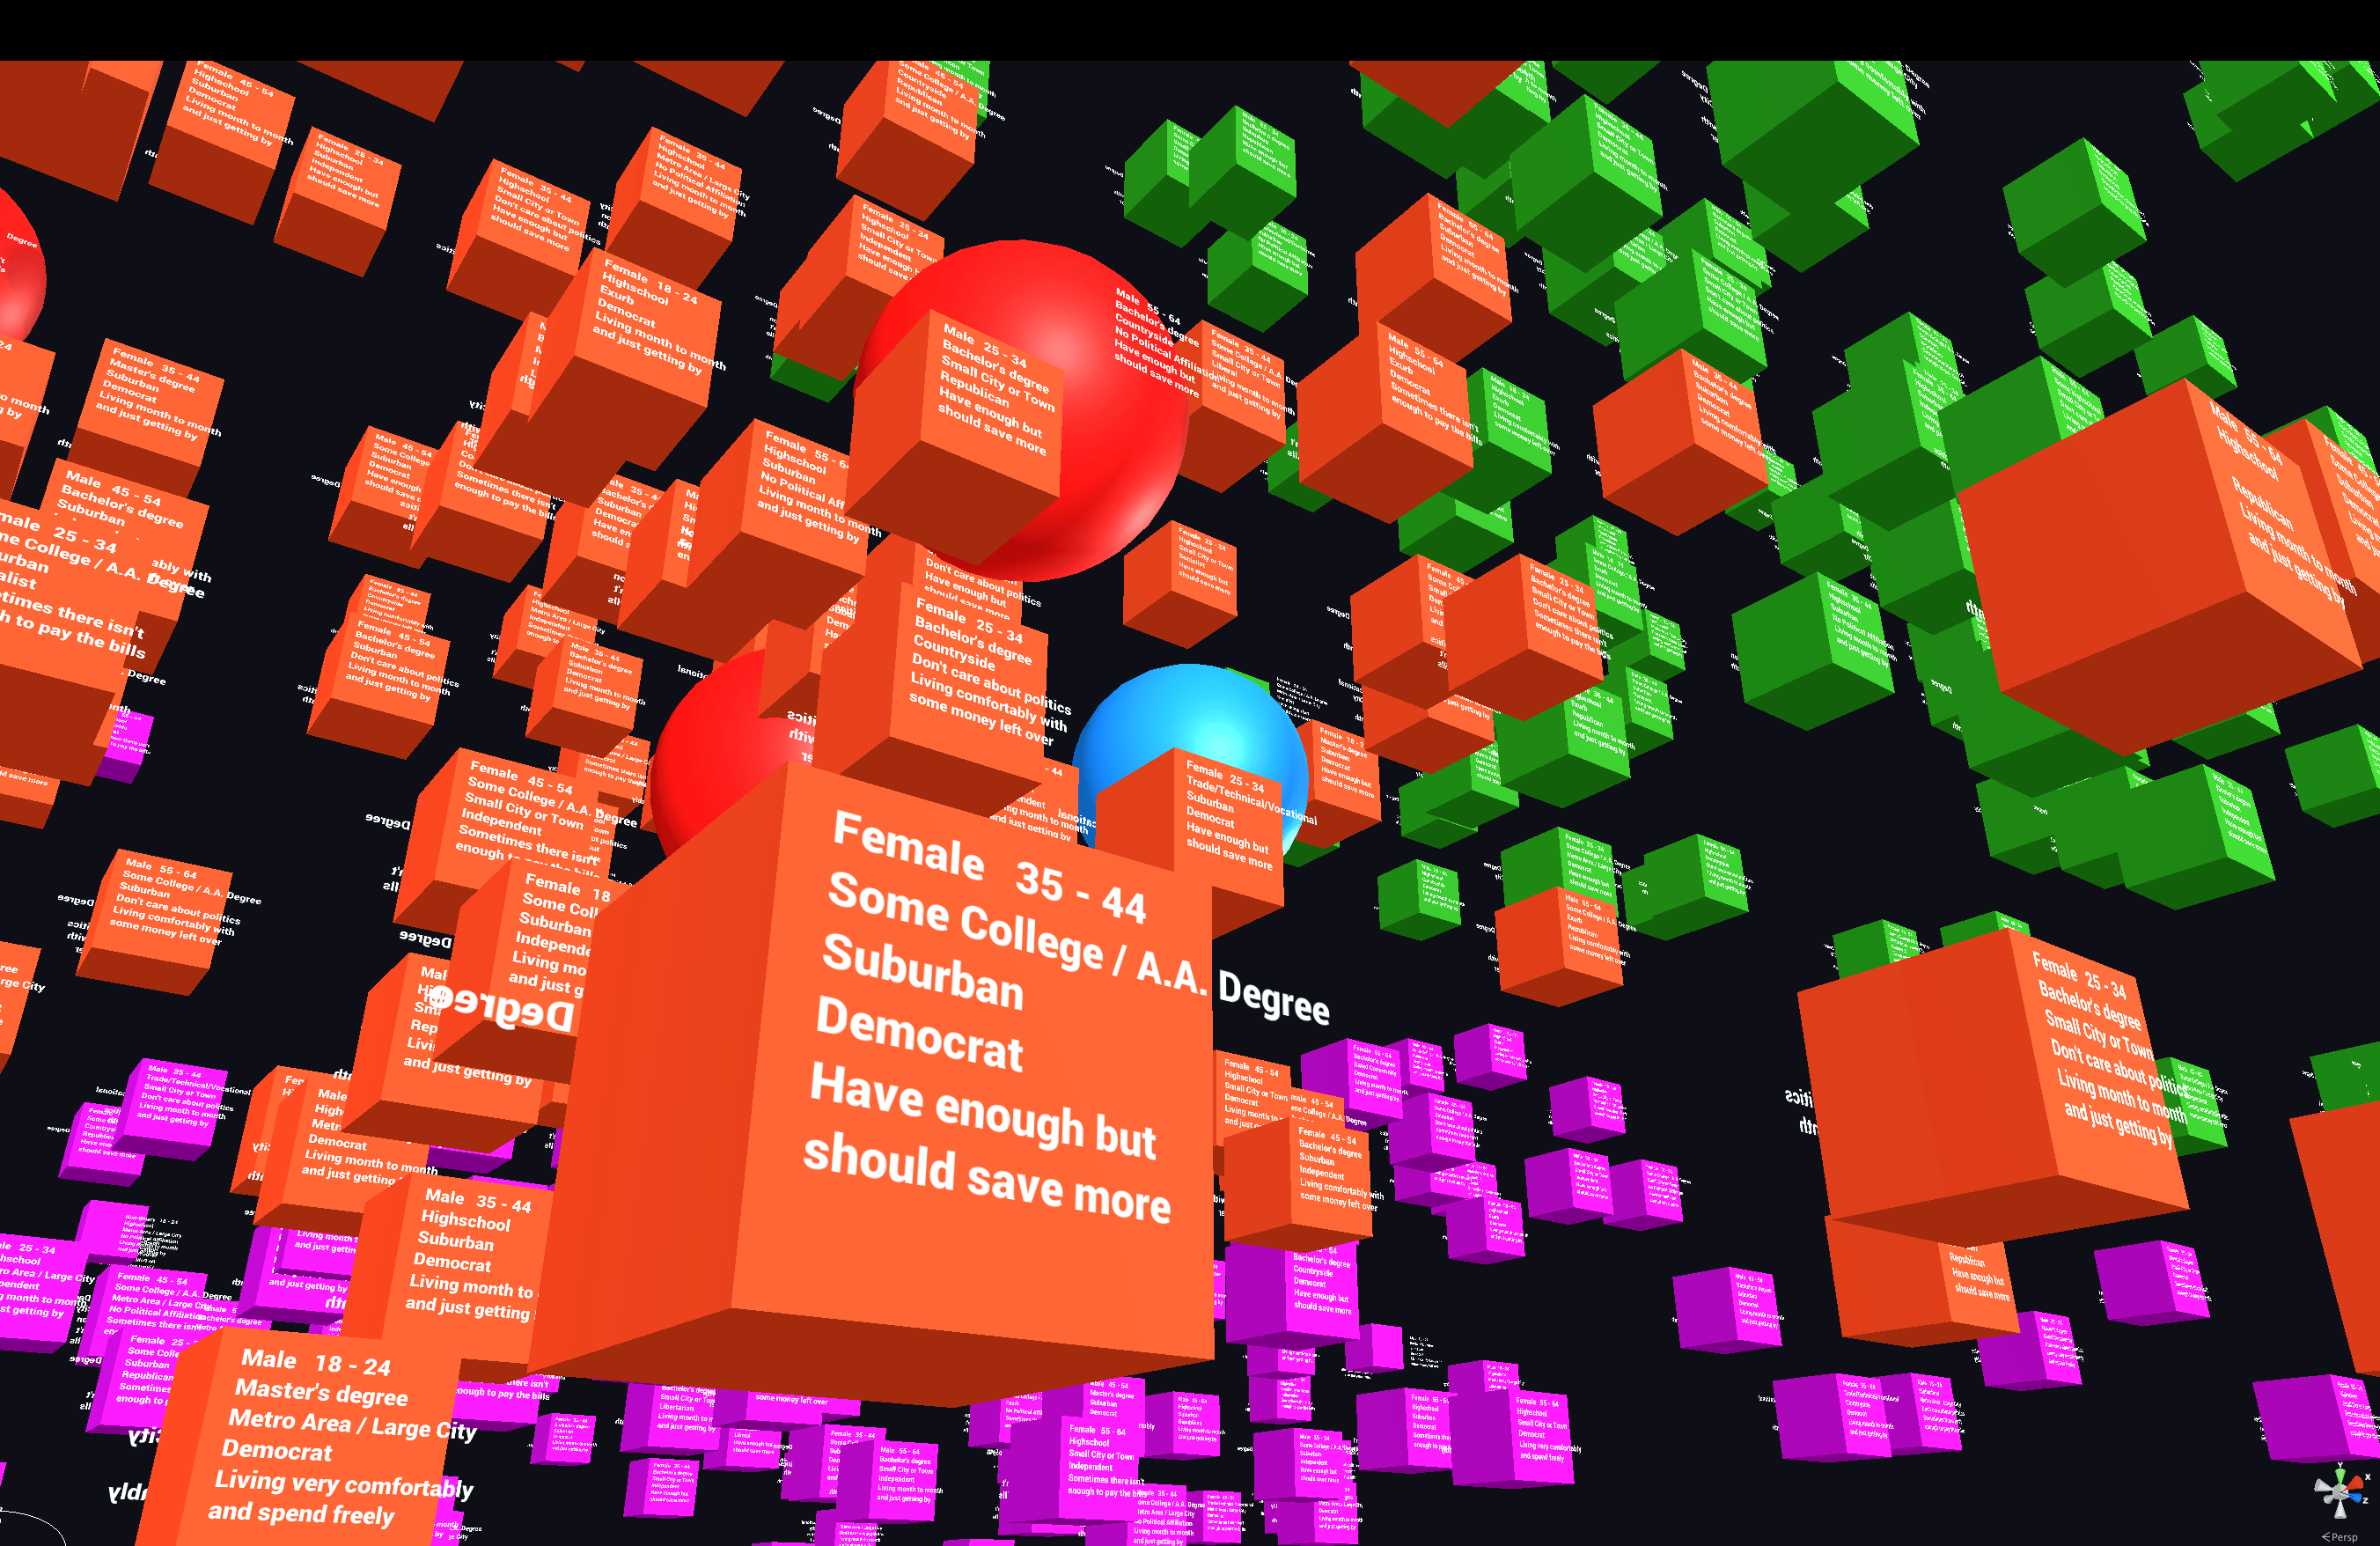
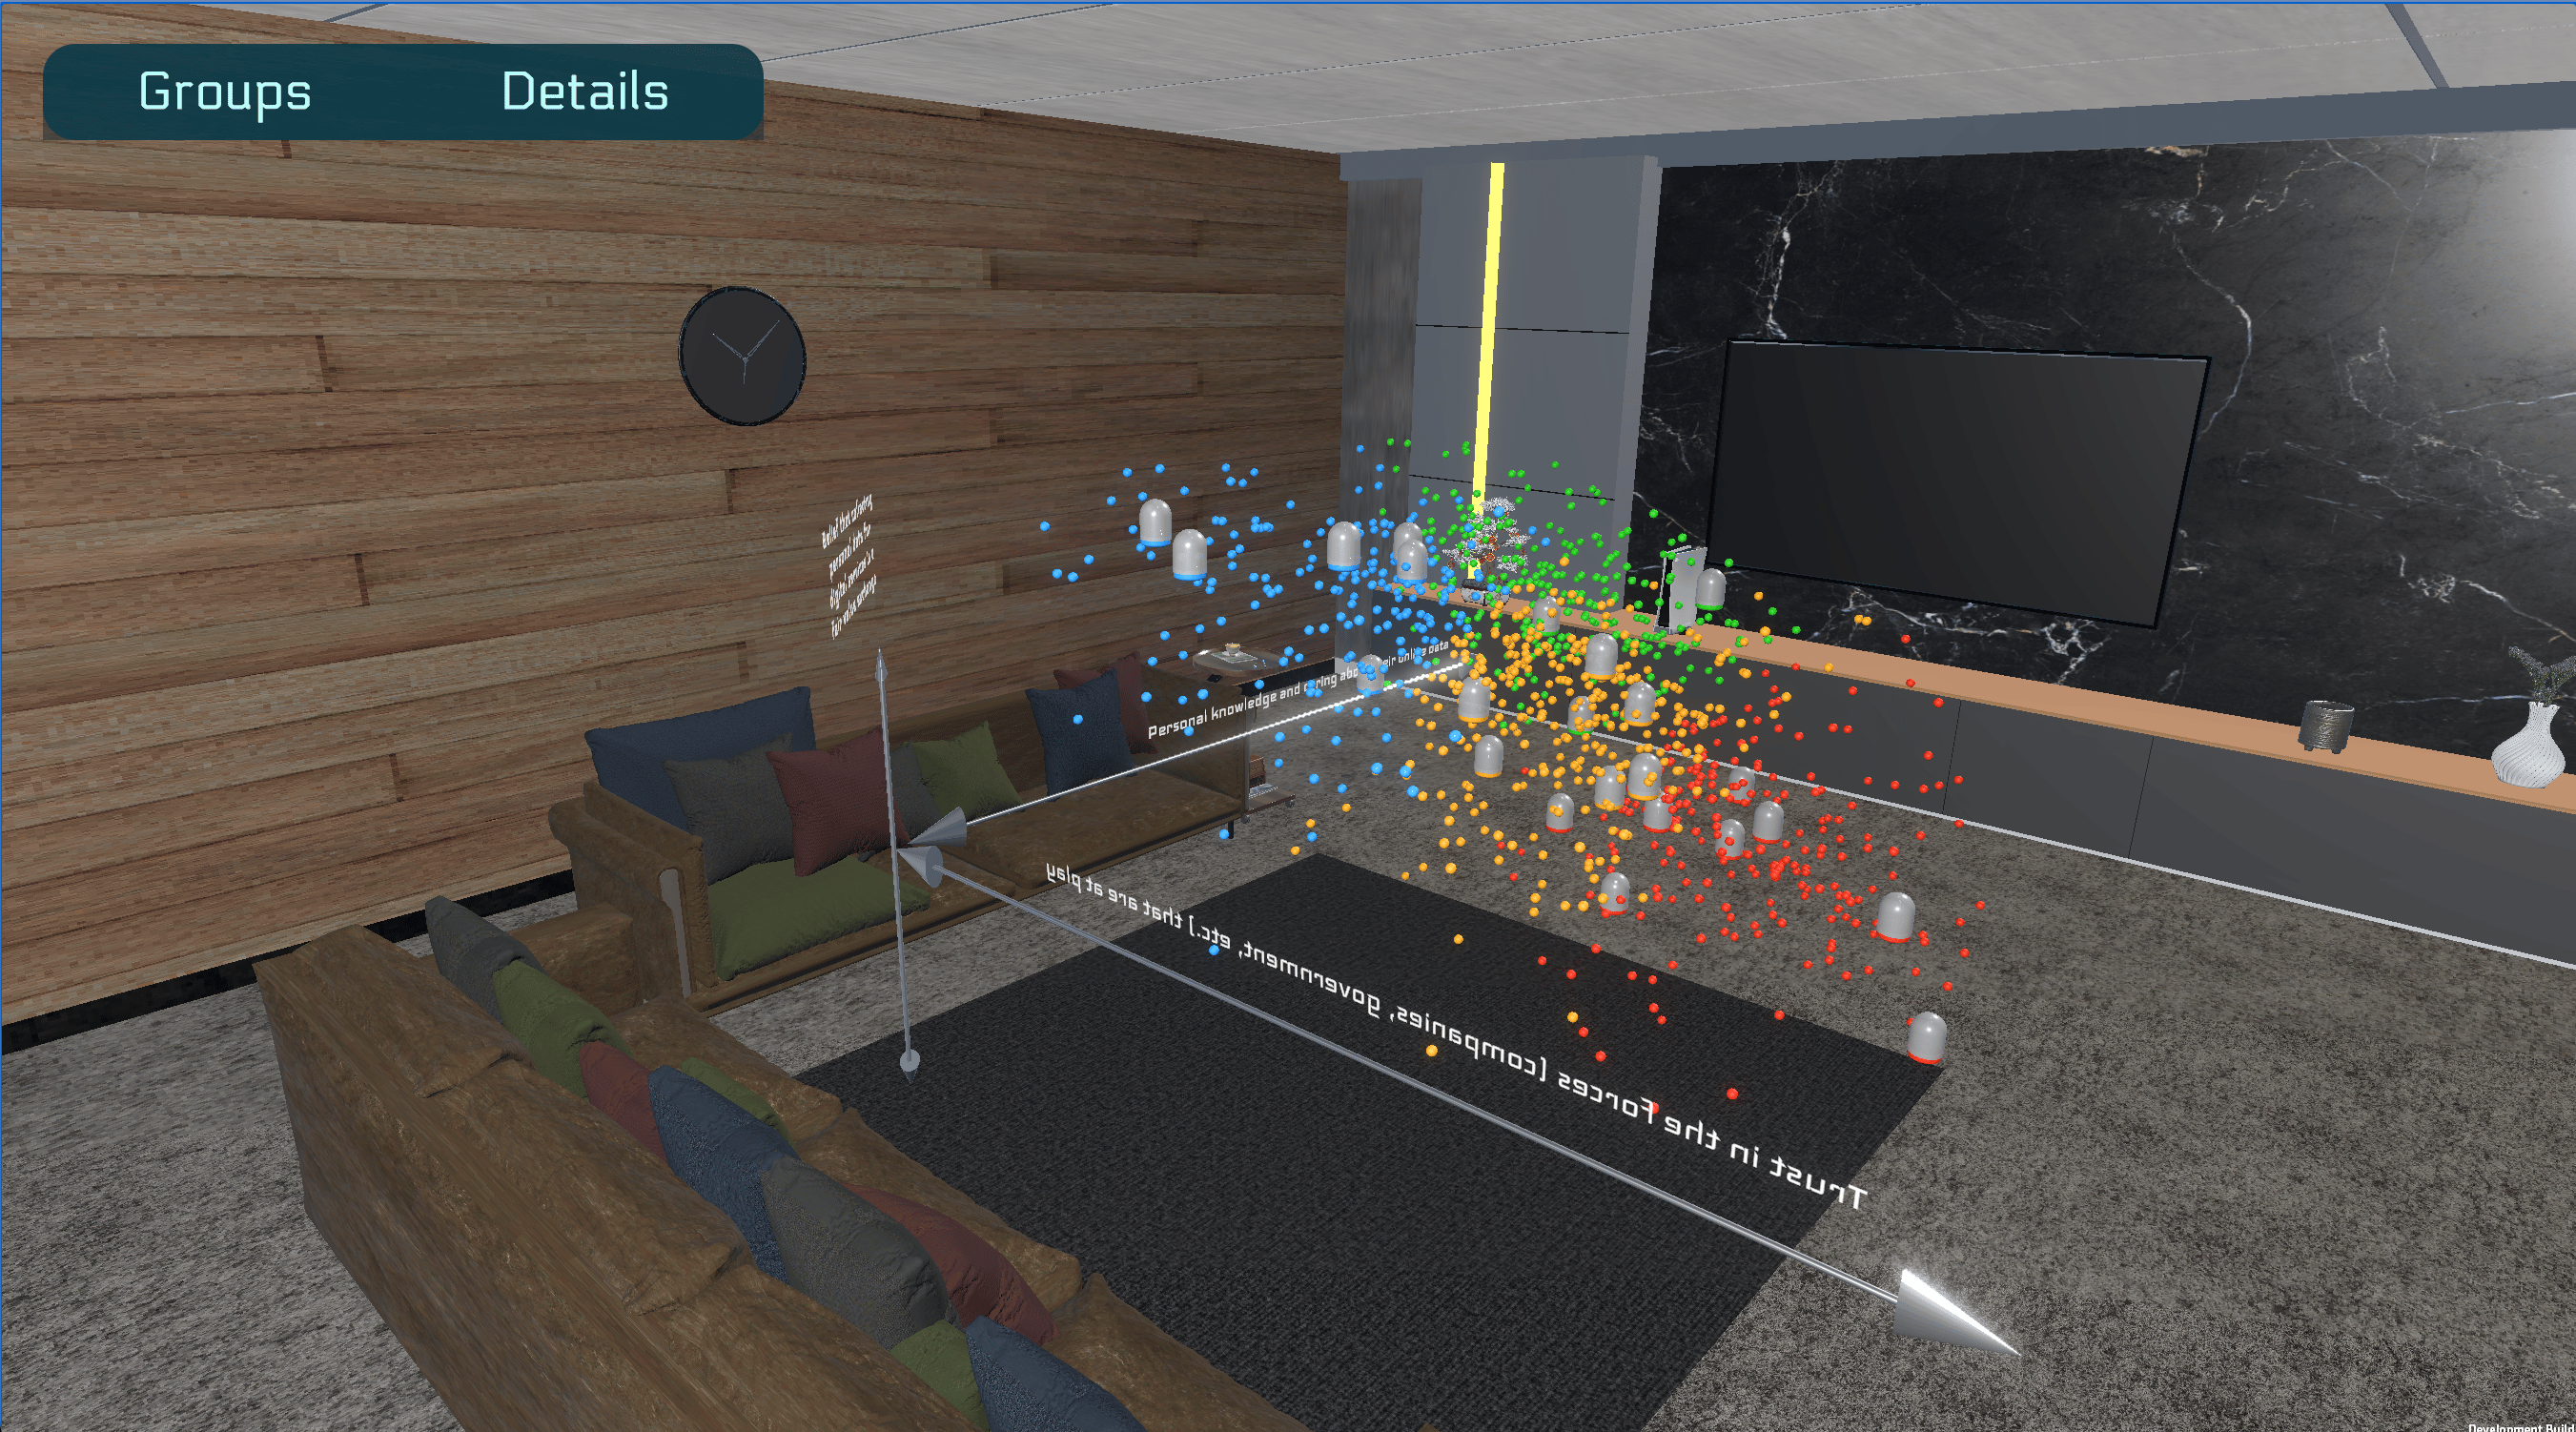
Version 1.0
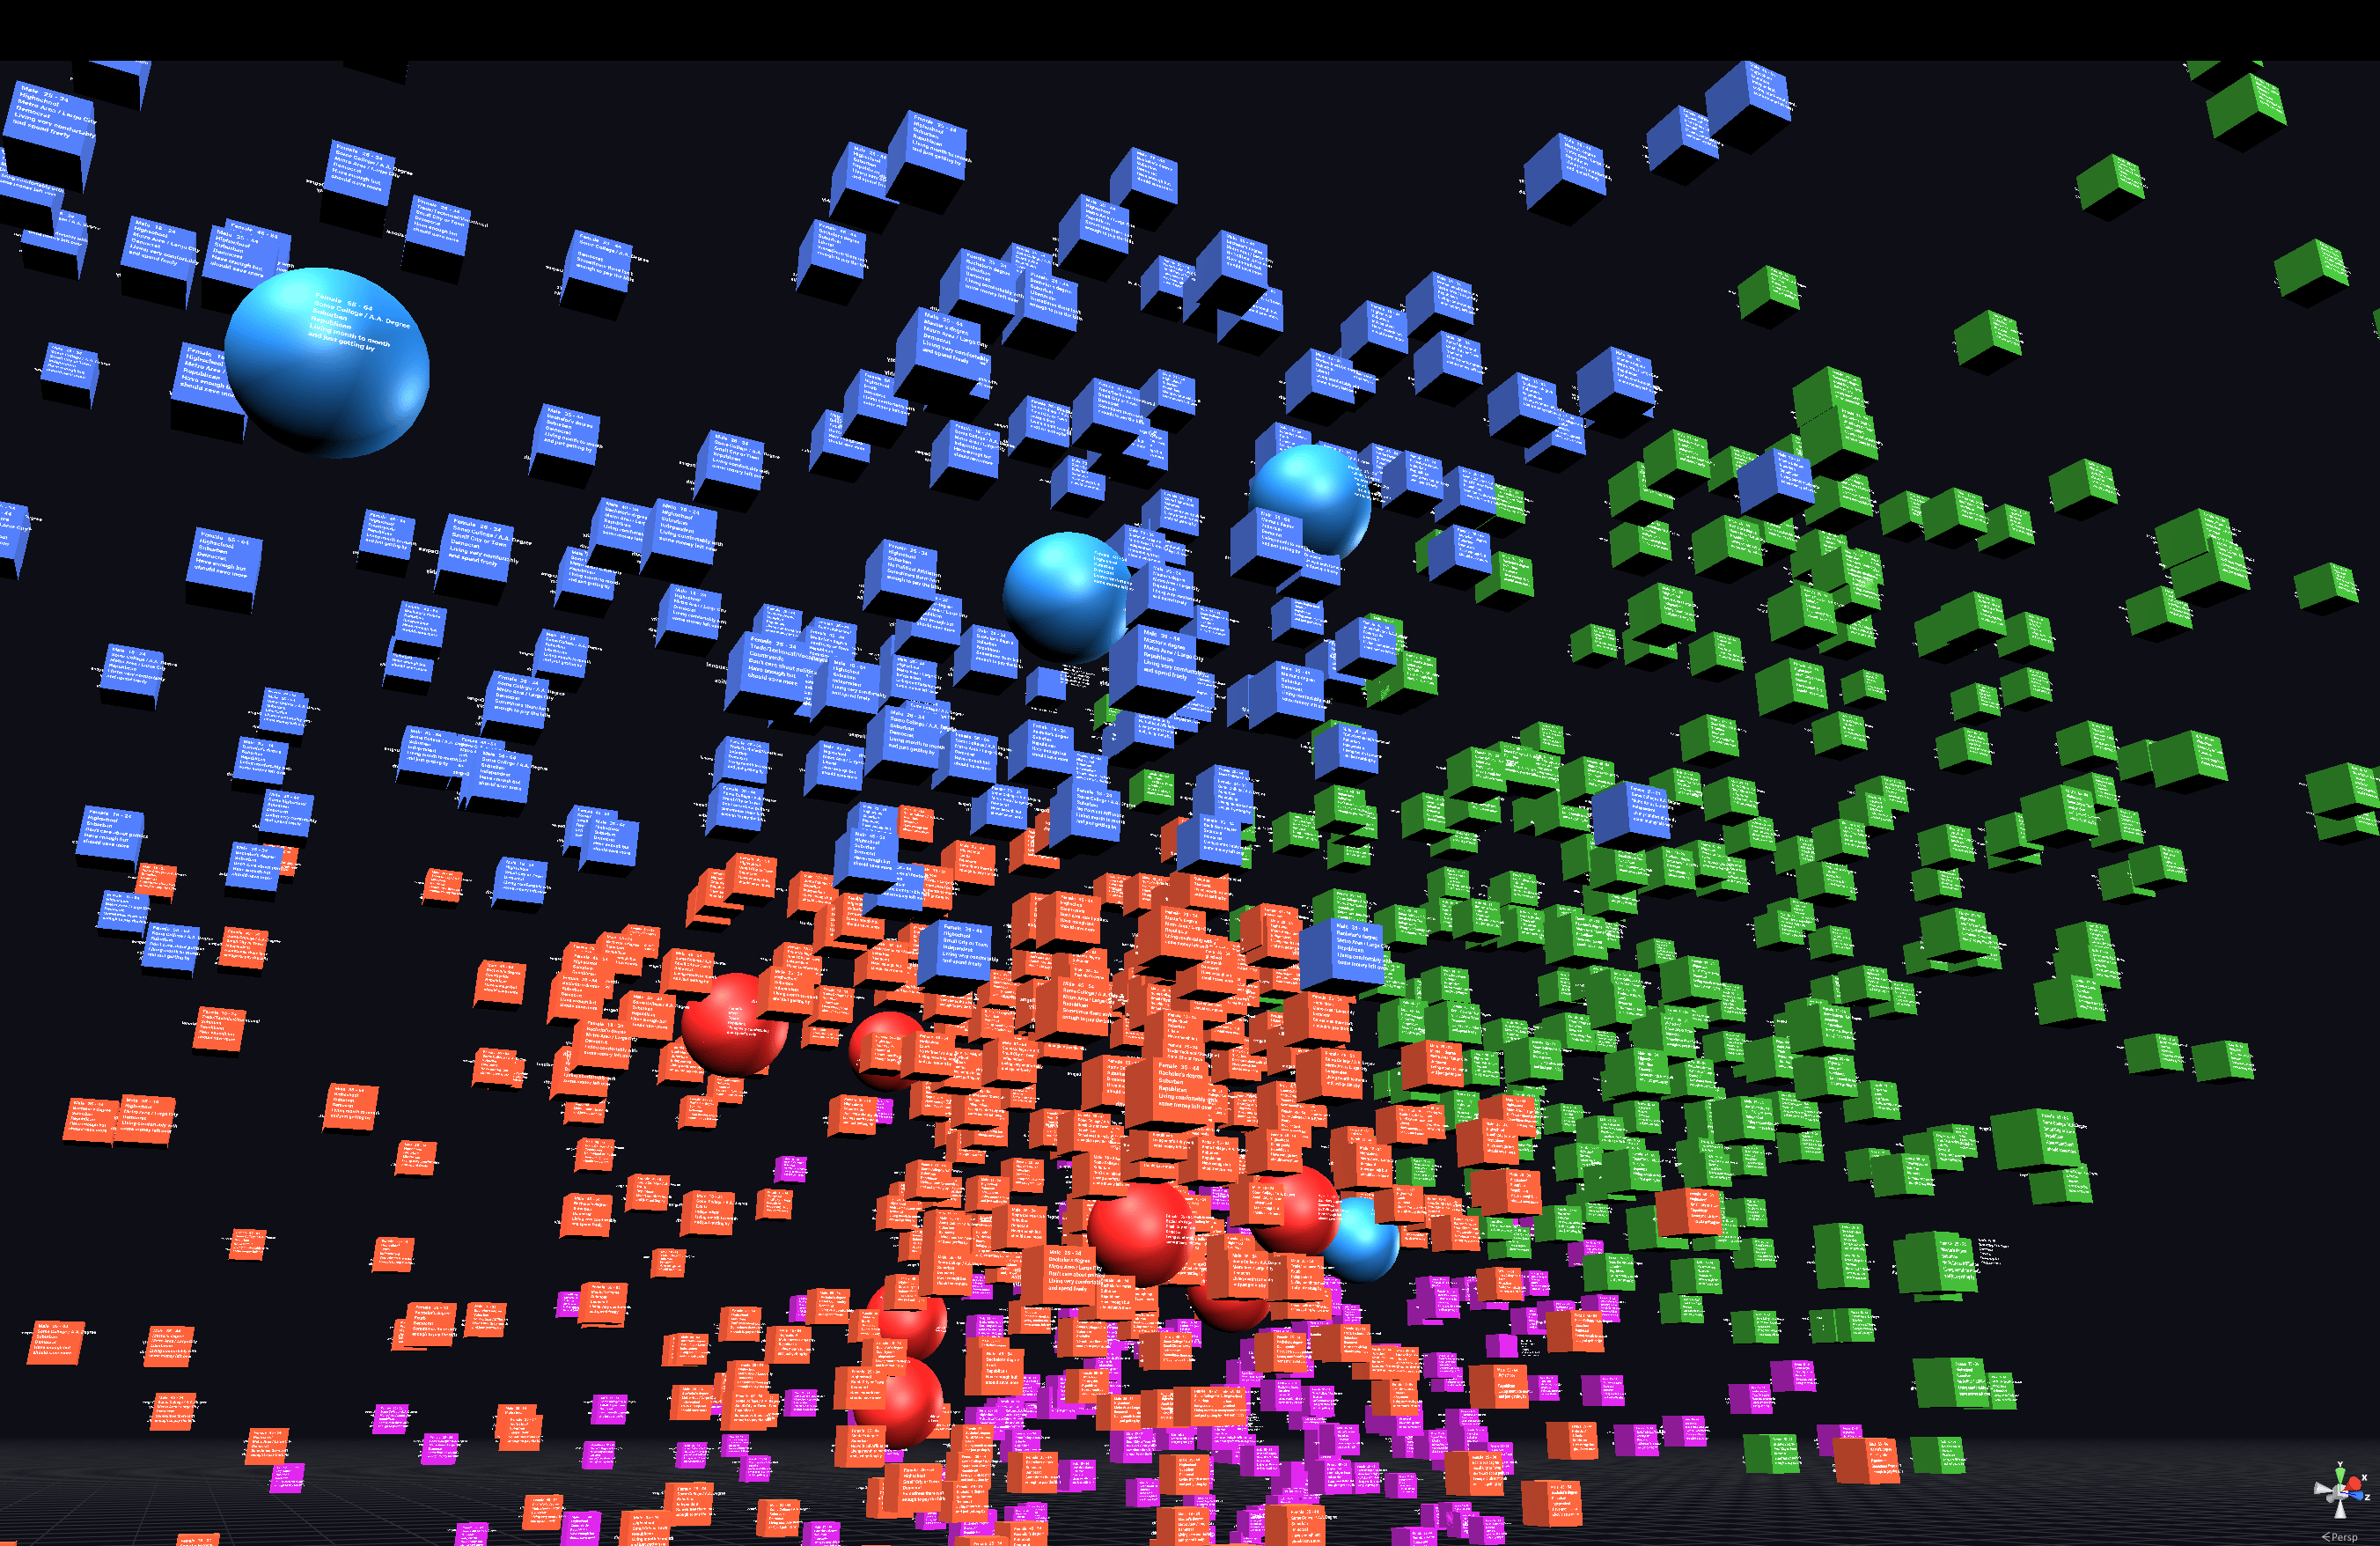
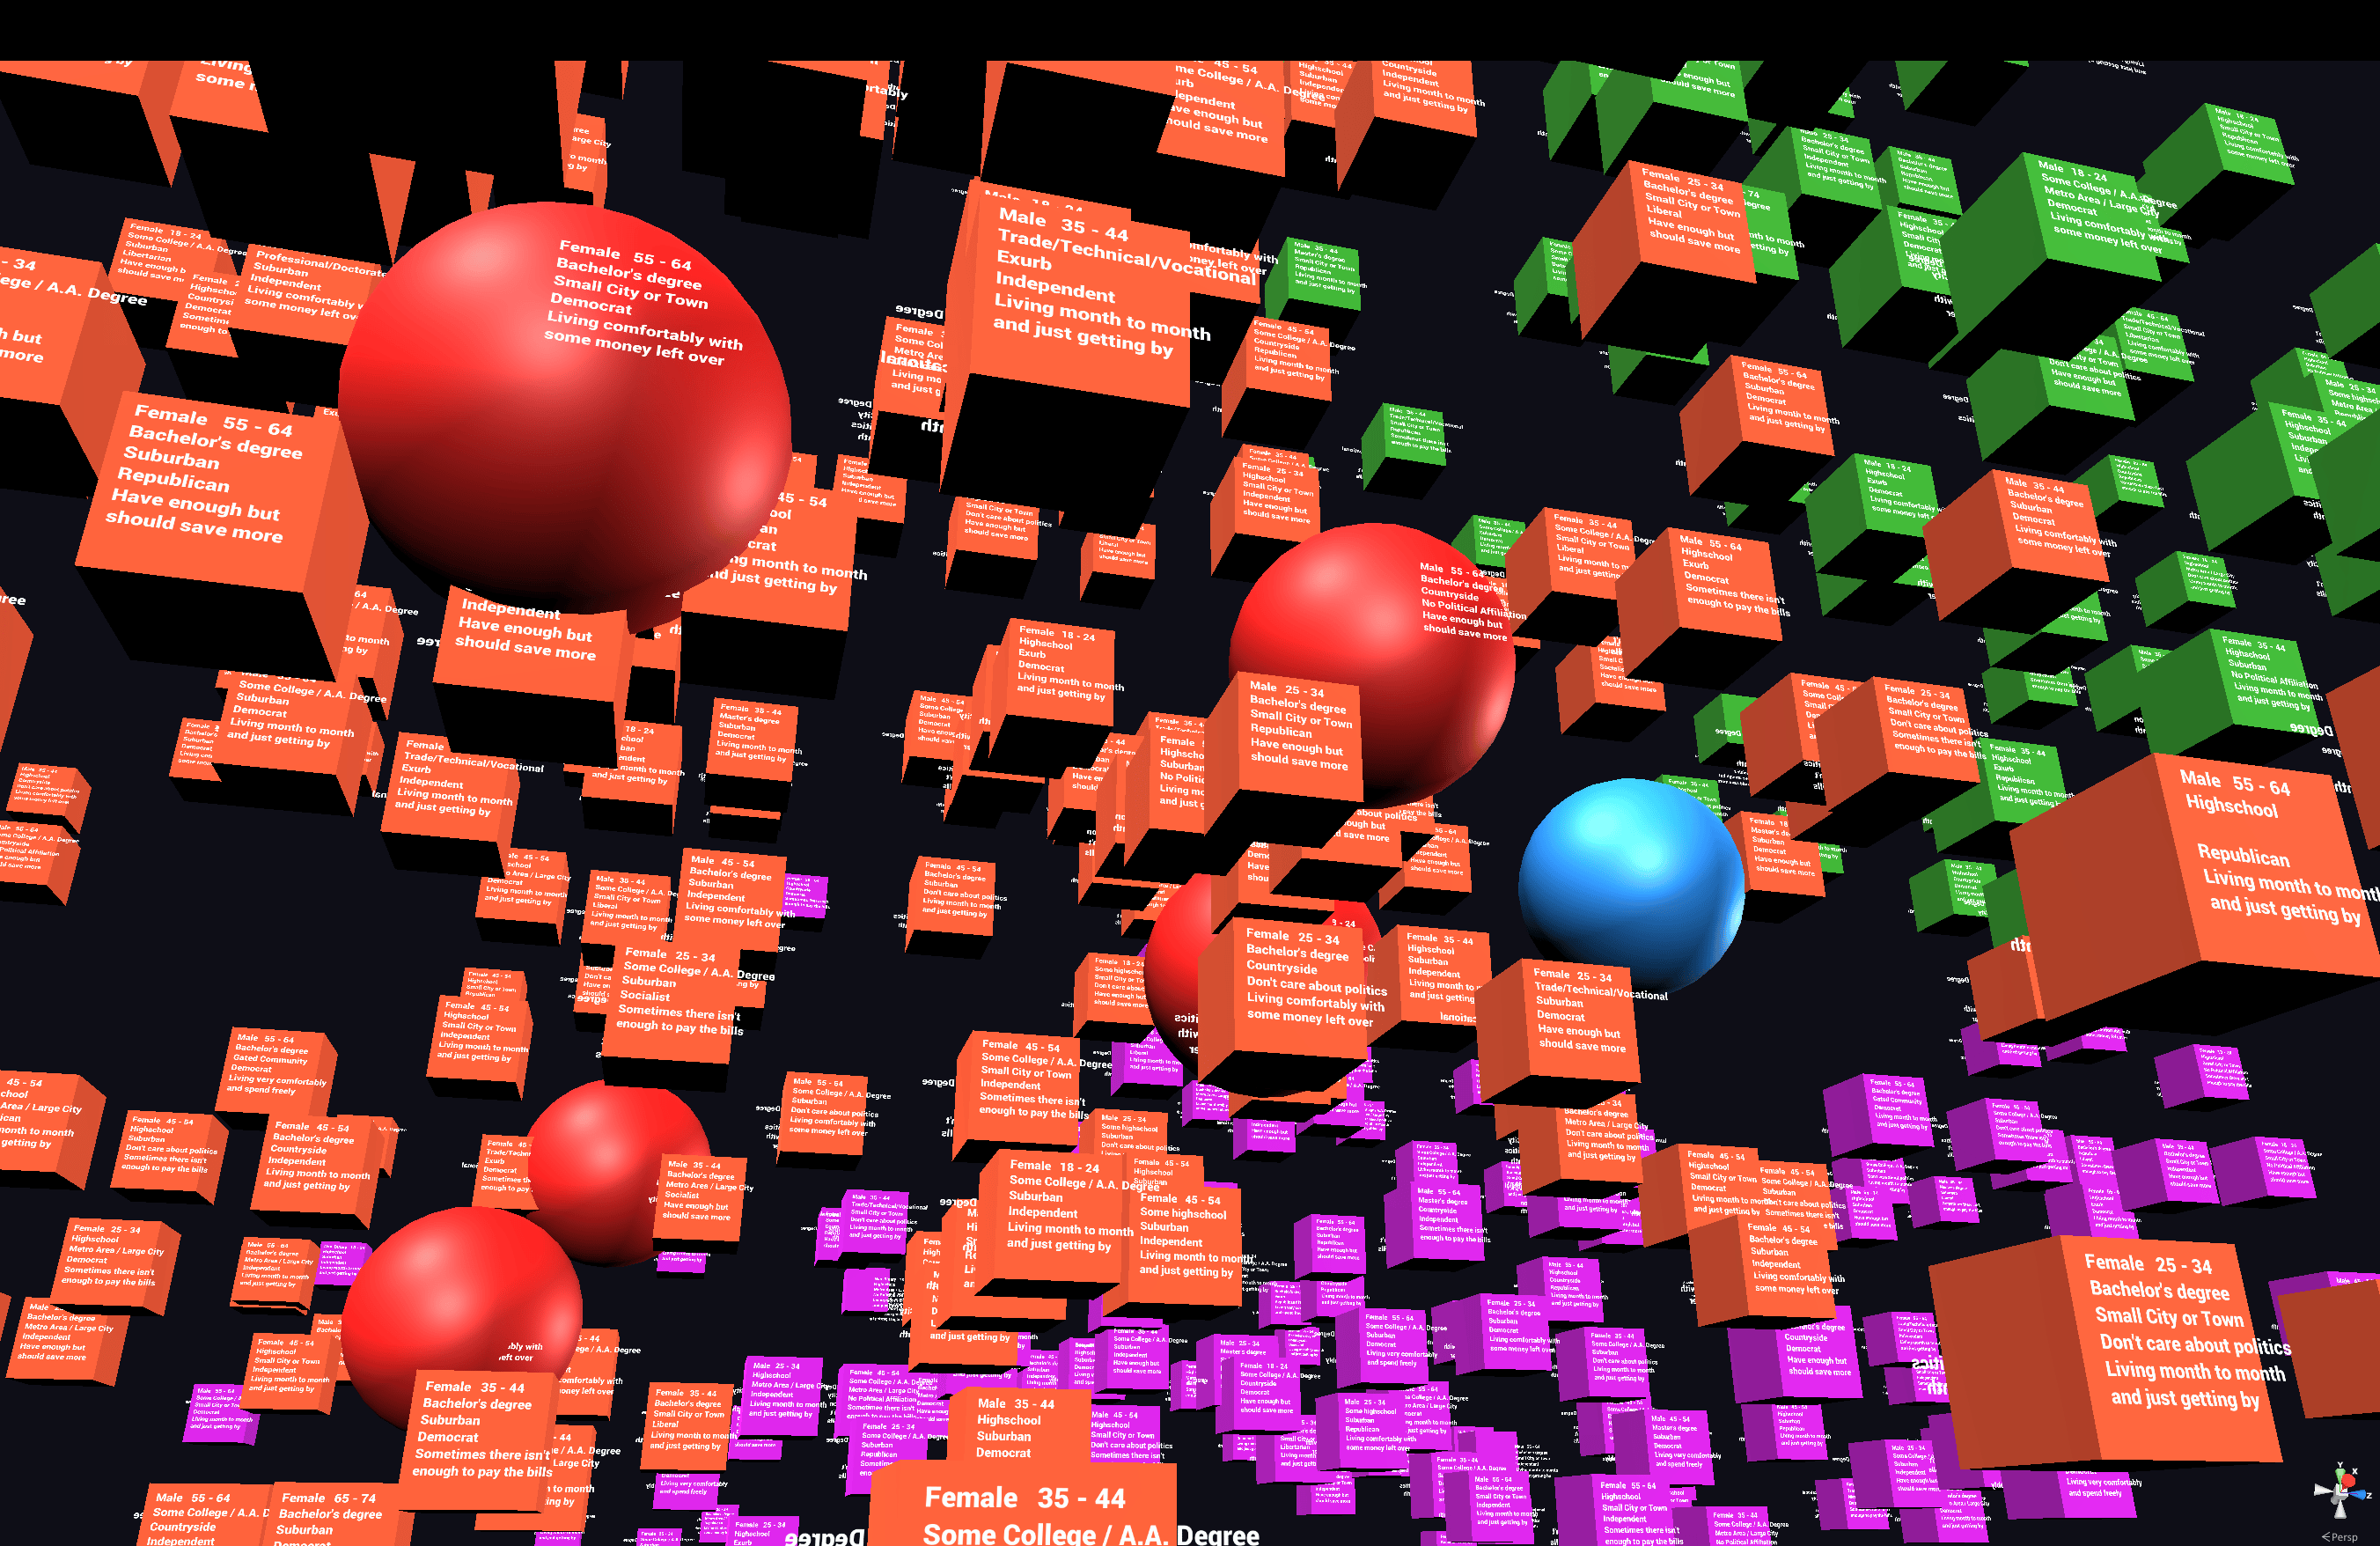
Version 1.0 of the experience was successful, albeit a little rough around the edges in terms of visual design. Data points were mapped across 3 dimensions and given a color corresponding to their cluster within the dataset. Additional metadata values for each datapoint were displayed as text labels on the front and back of the datapoint objects. Primitive shapes were used for the objects, with most datapoints being simple cubes and the ~20 datapoints with audio clips attached to them being spheres. When touched, a sphere would begin to pulse gently and play its audio clip.
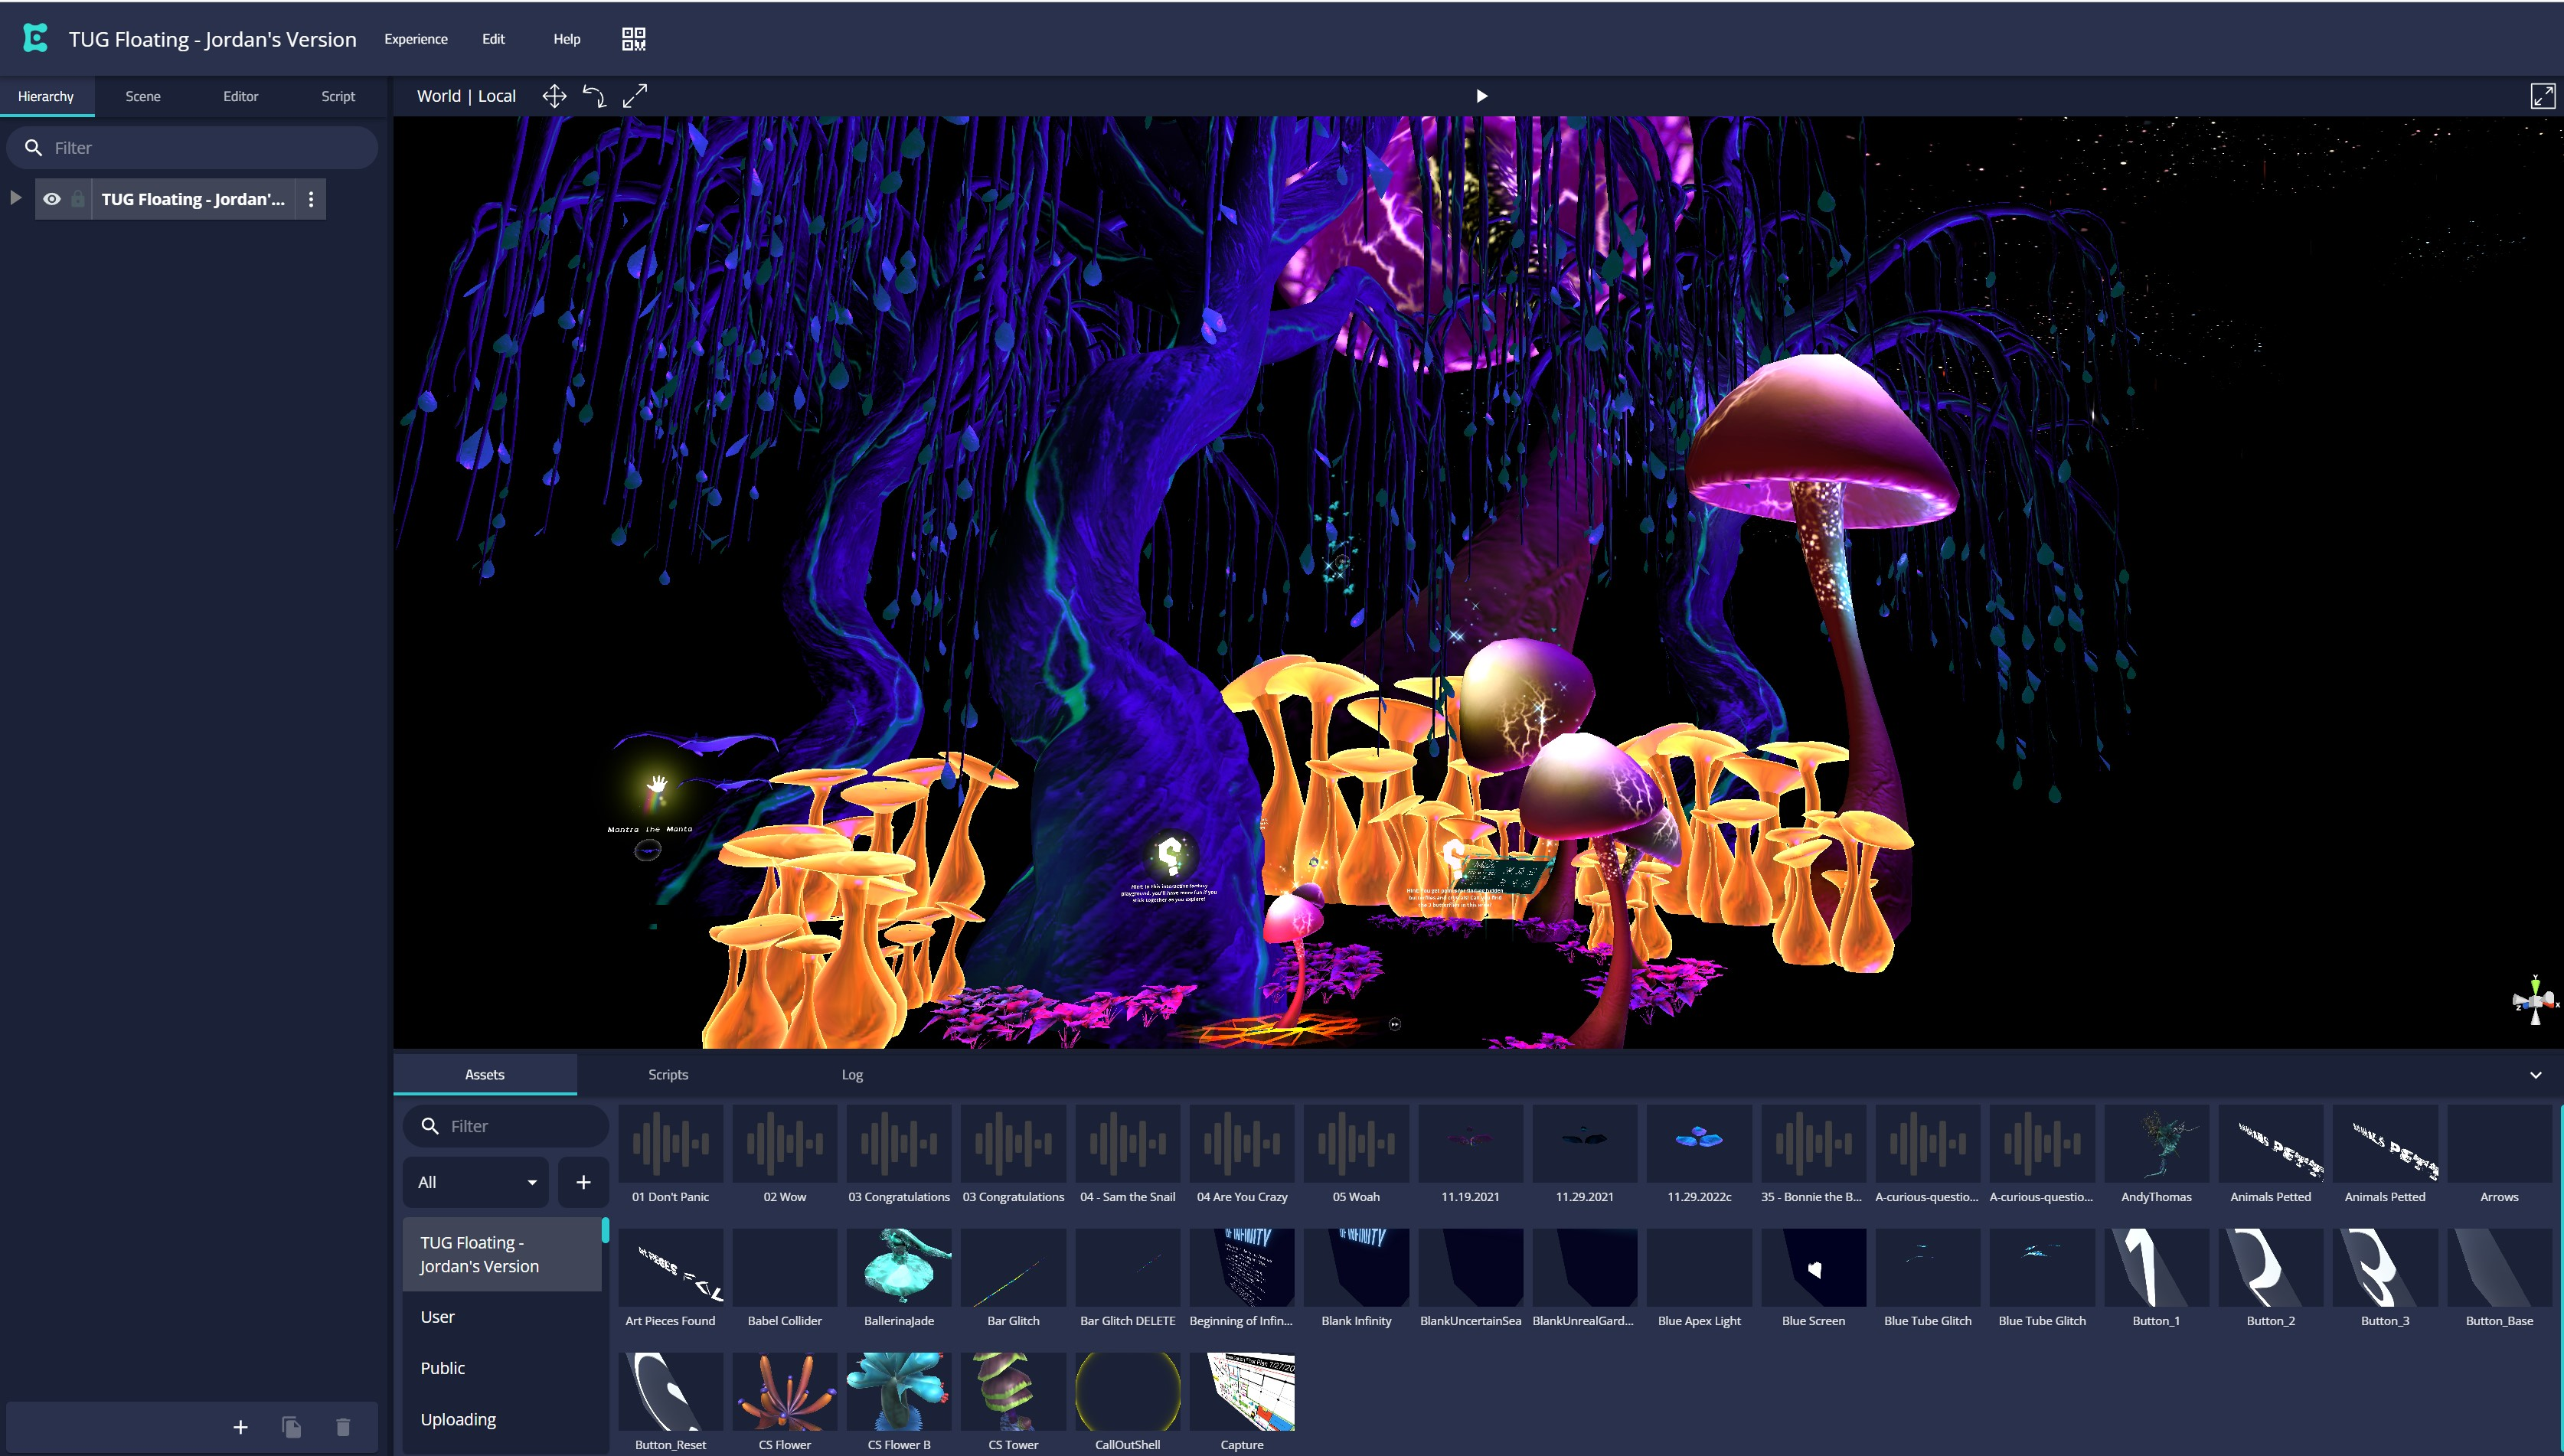
Version 2.0
For version 2.0, I had a few new objectives:
- Make it accessible from a desktop web browser
- Improve the visual design and legibility
- Contextualize the experience and its purpose within a more compelling and immersive narrative relevant to today
Because it wasn’t going to be experienced on an XR headset for this version, I could do everything right from Unity instead of going through Enklu.
And this time I had a new tool: Bezi.
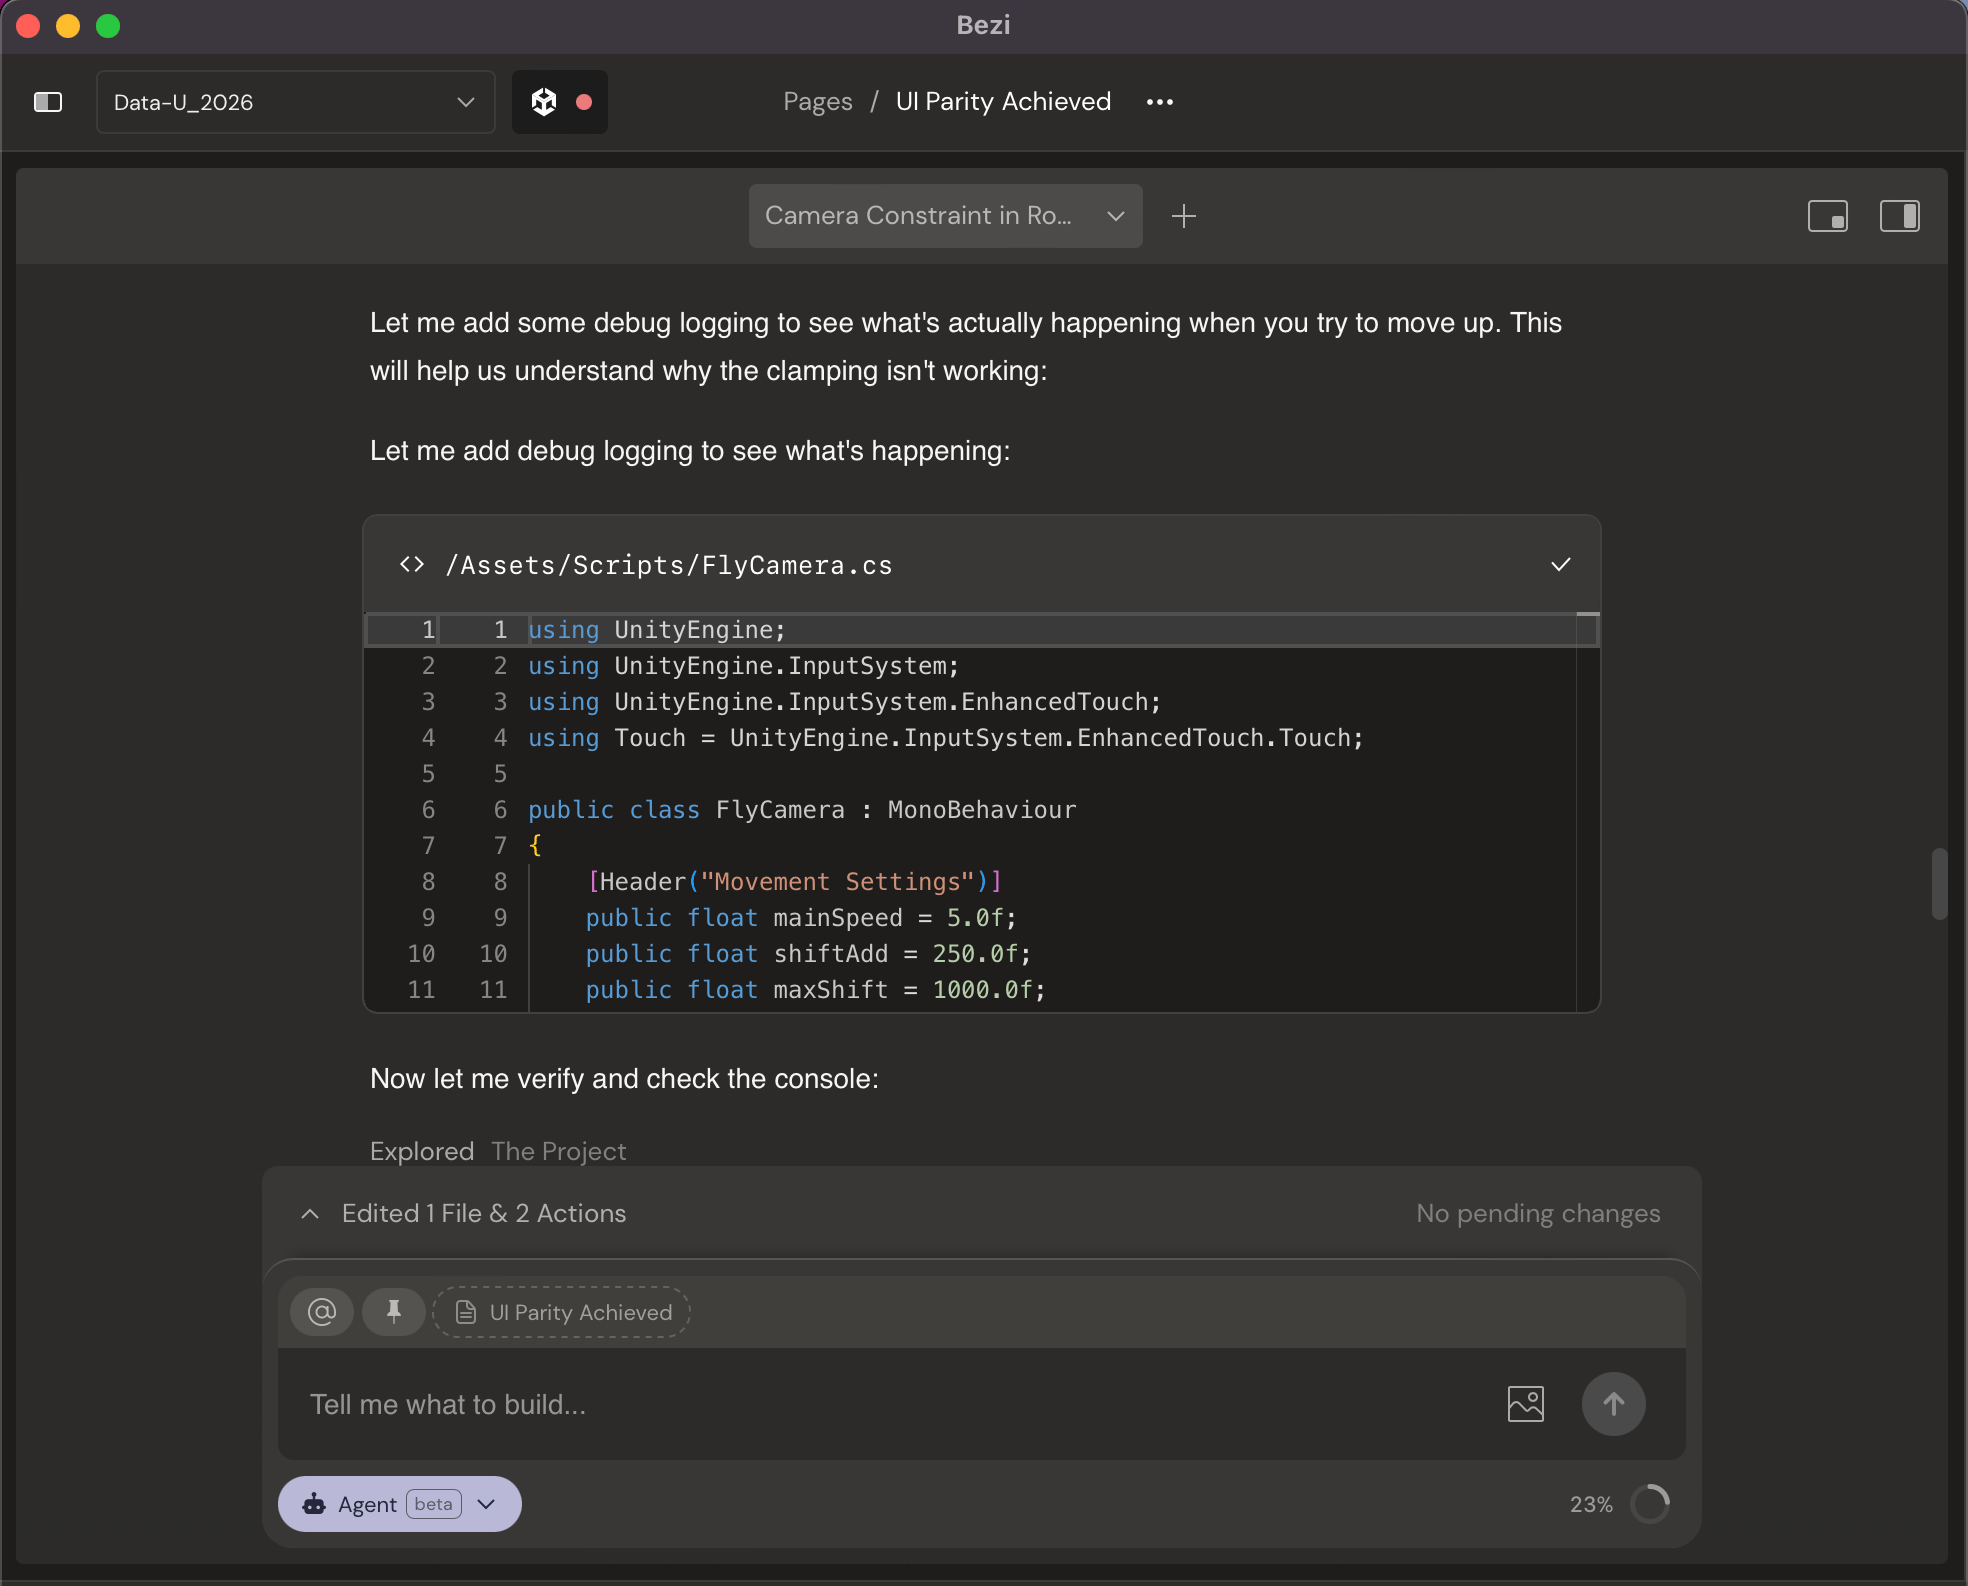

Bezi is a project-aware AI assistant that integrated directly into my Unity project to help me prototype and debug quickly. As a non-engineer and someone who doesn’t have a background in game development, this was incredibly helpful for me.
By using an integrated AI tool, I was able to spend more time thinking about and designing the user experience instead of struggling with C# scripts and technical settings.
I took this second iteration of the experience as an opportunity to learn and practice a few things:
This build brought in traditional elements of game, environment, and lighting design.
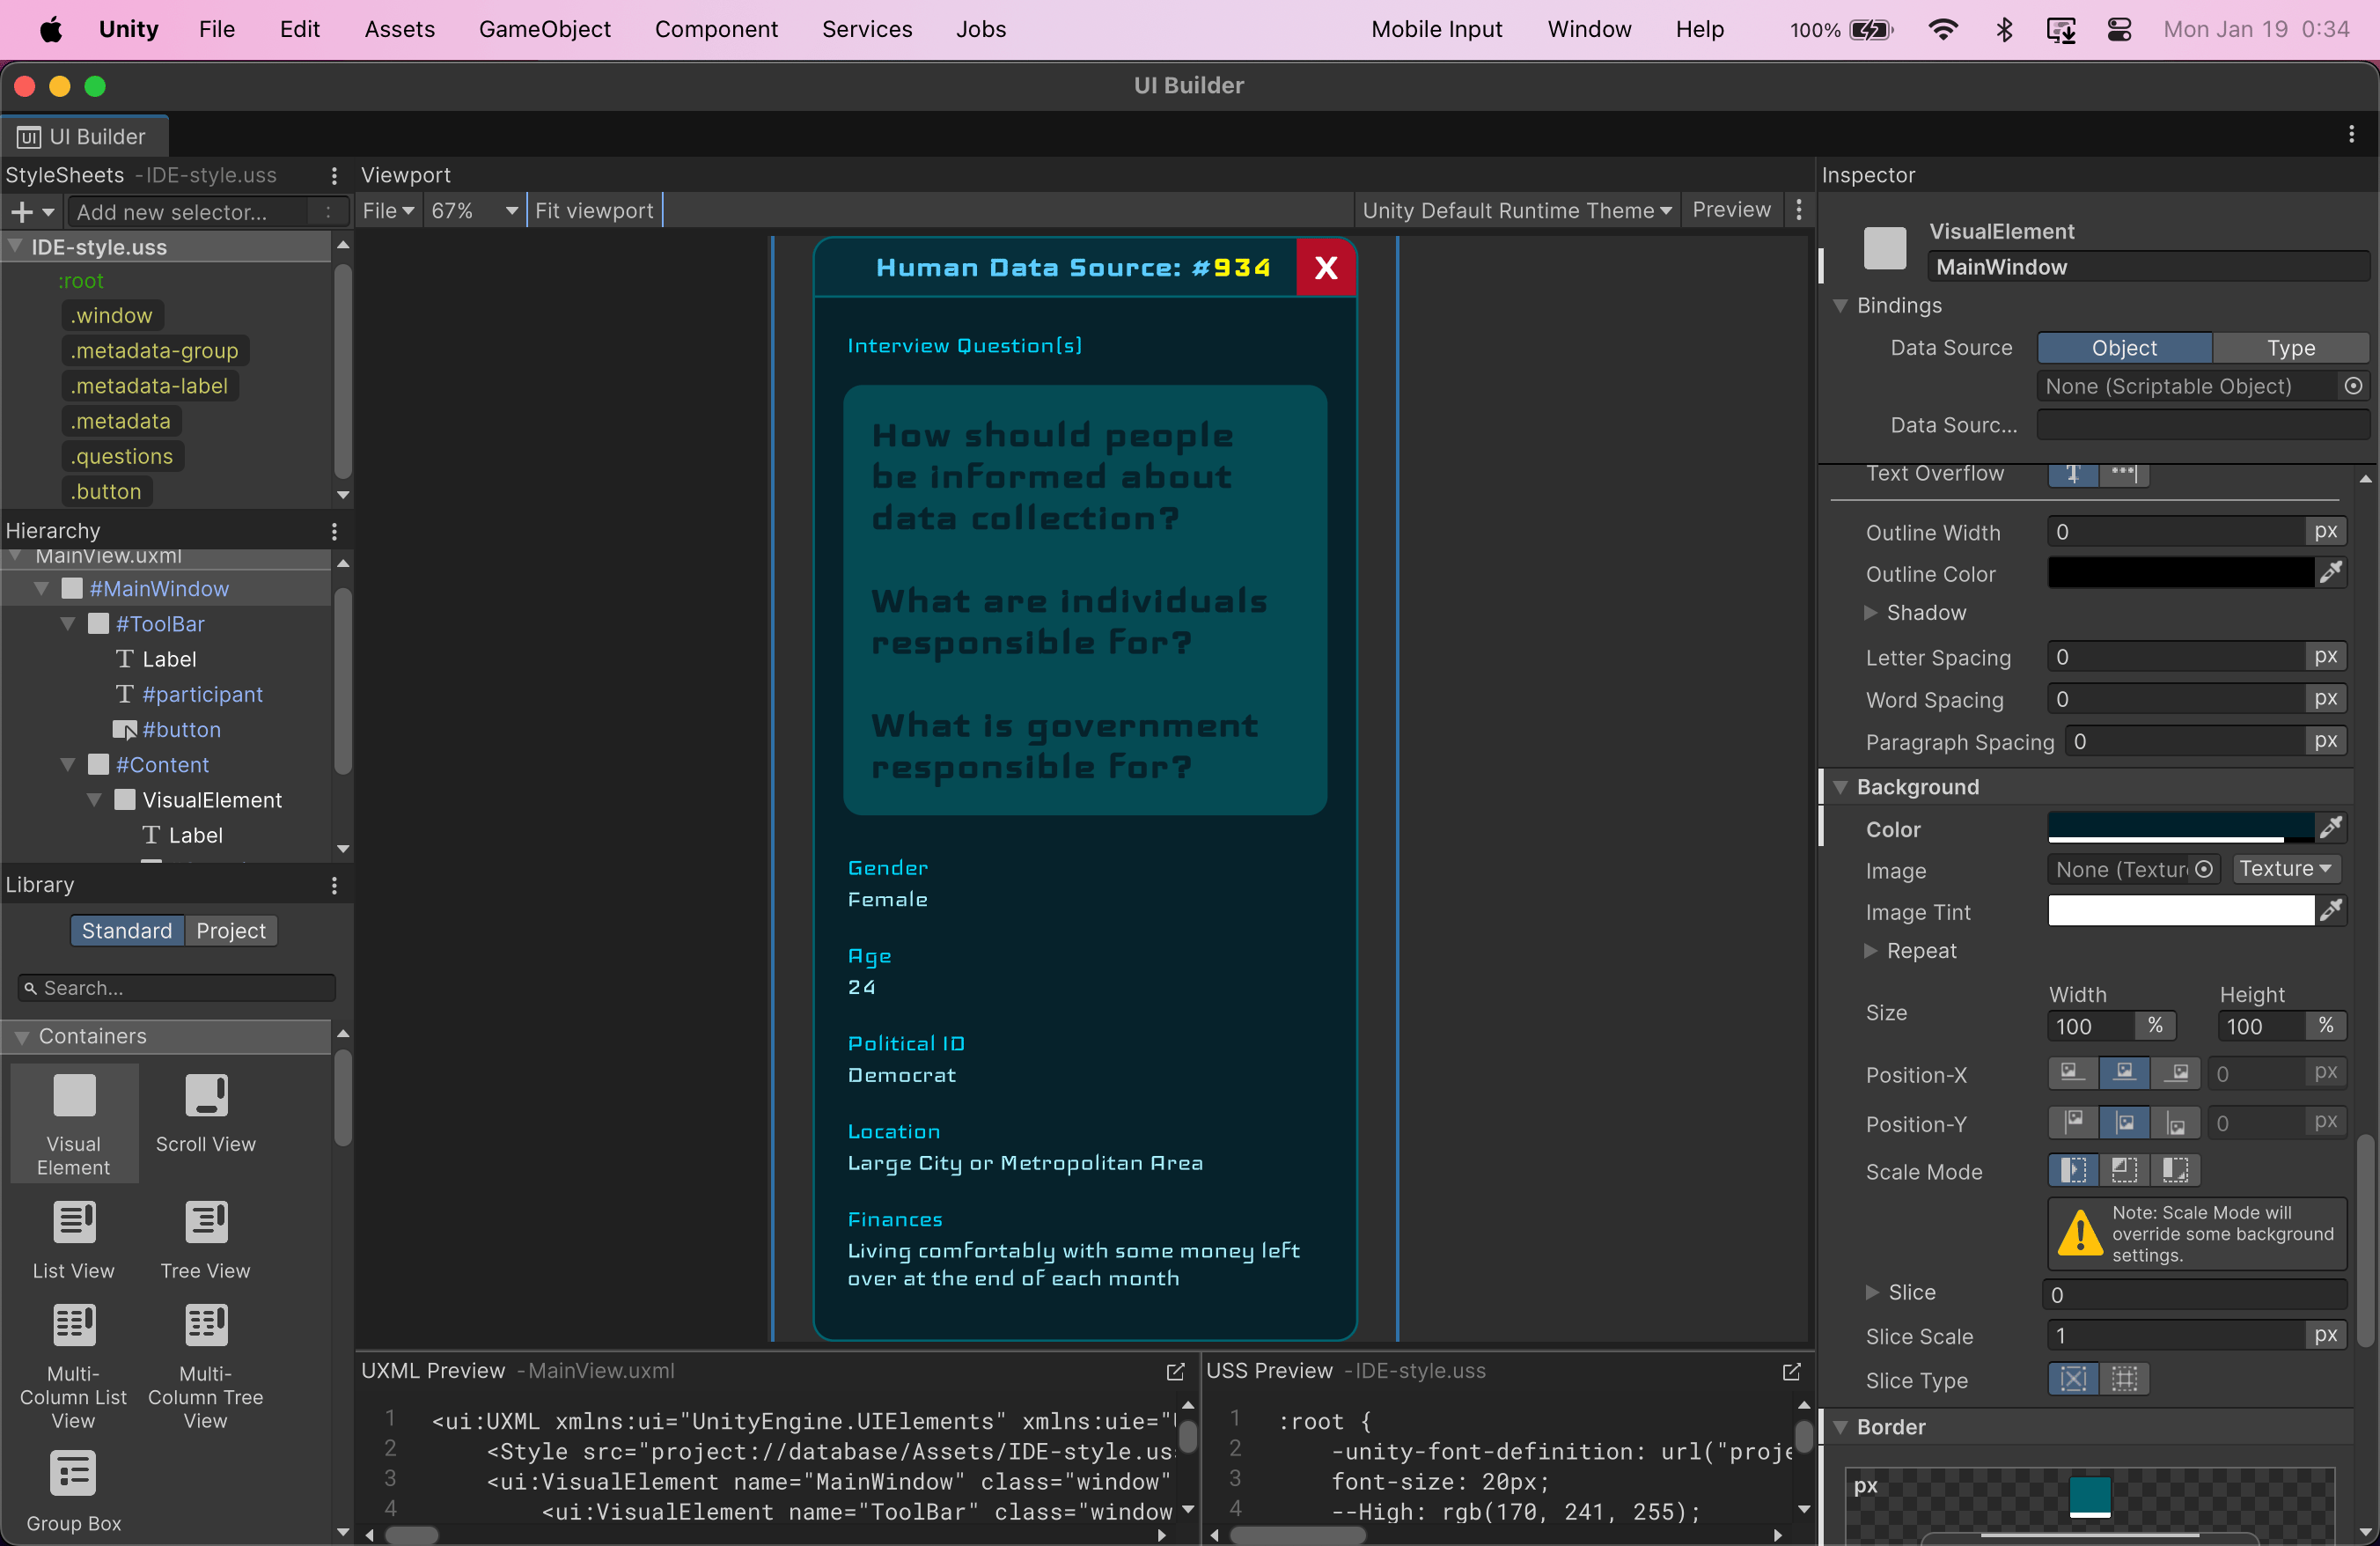
One of my first iterations of interactive UI overlays for the experience, using Unity’s new UI Toolkit framework and UI Builder
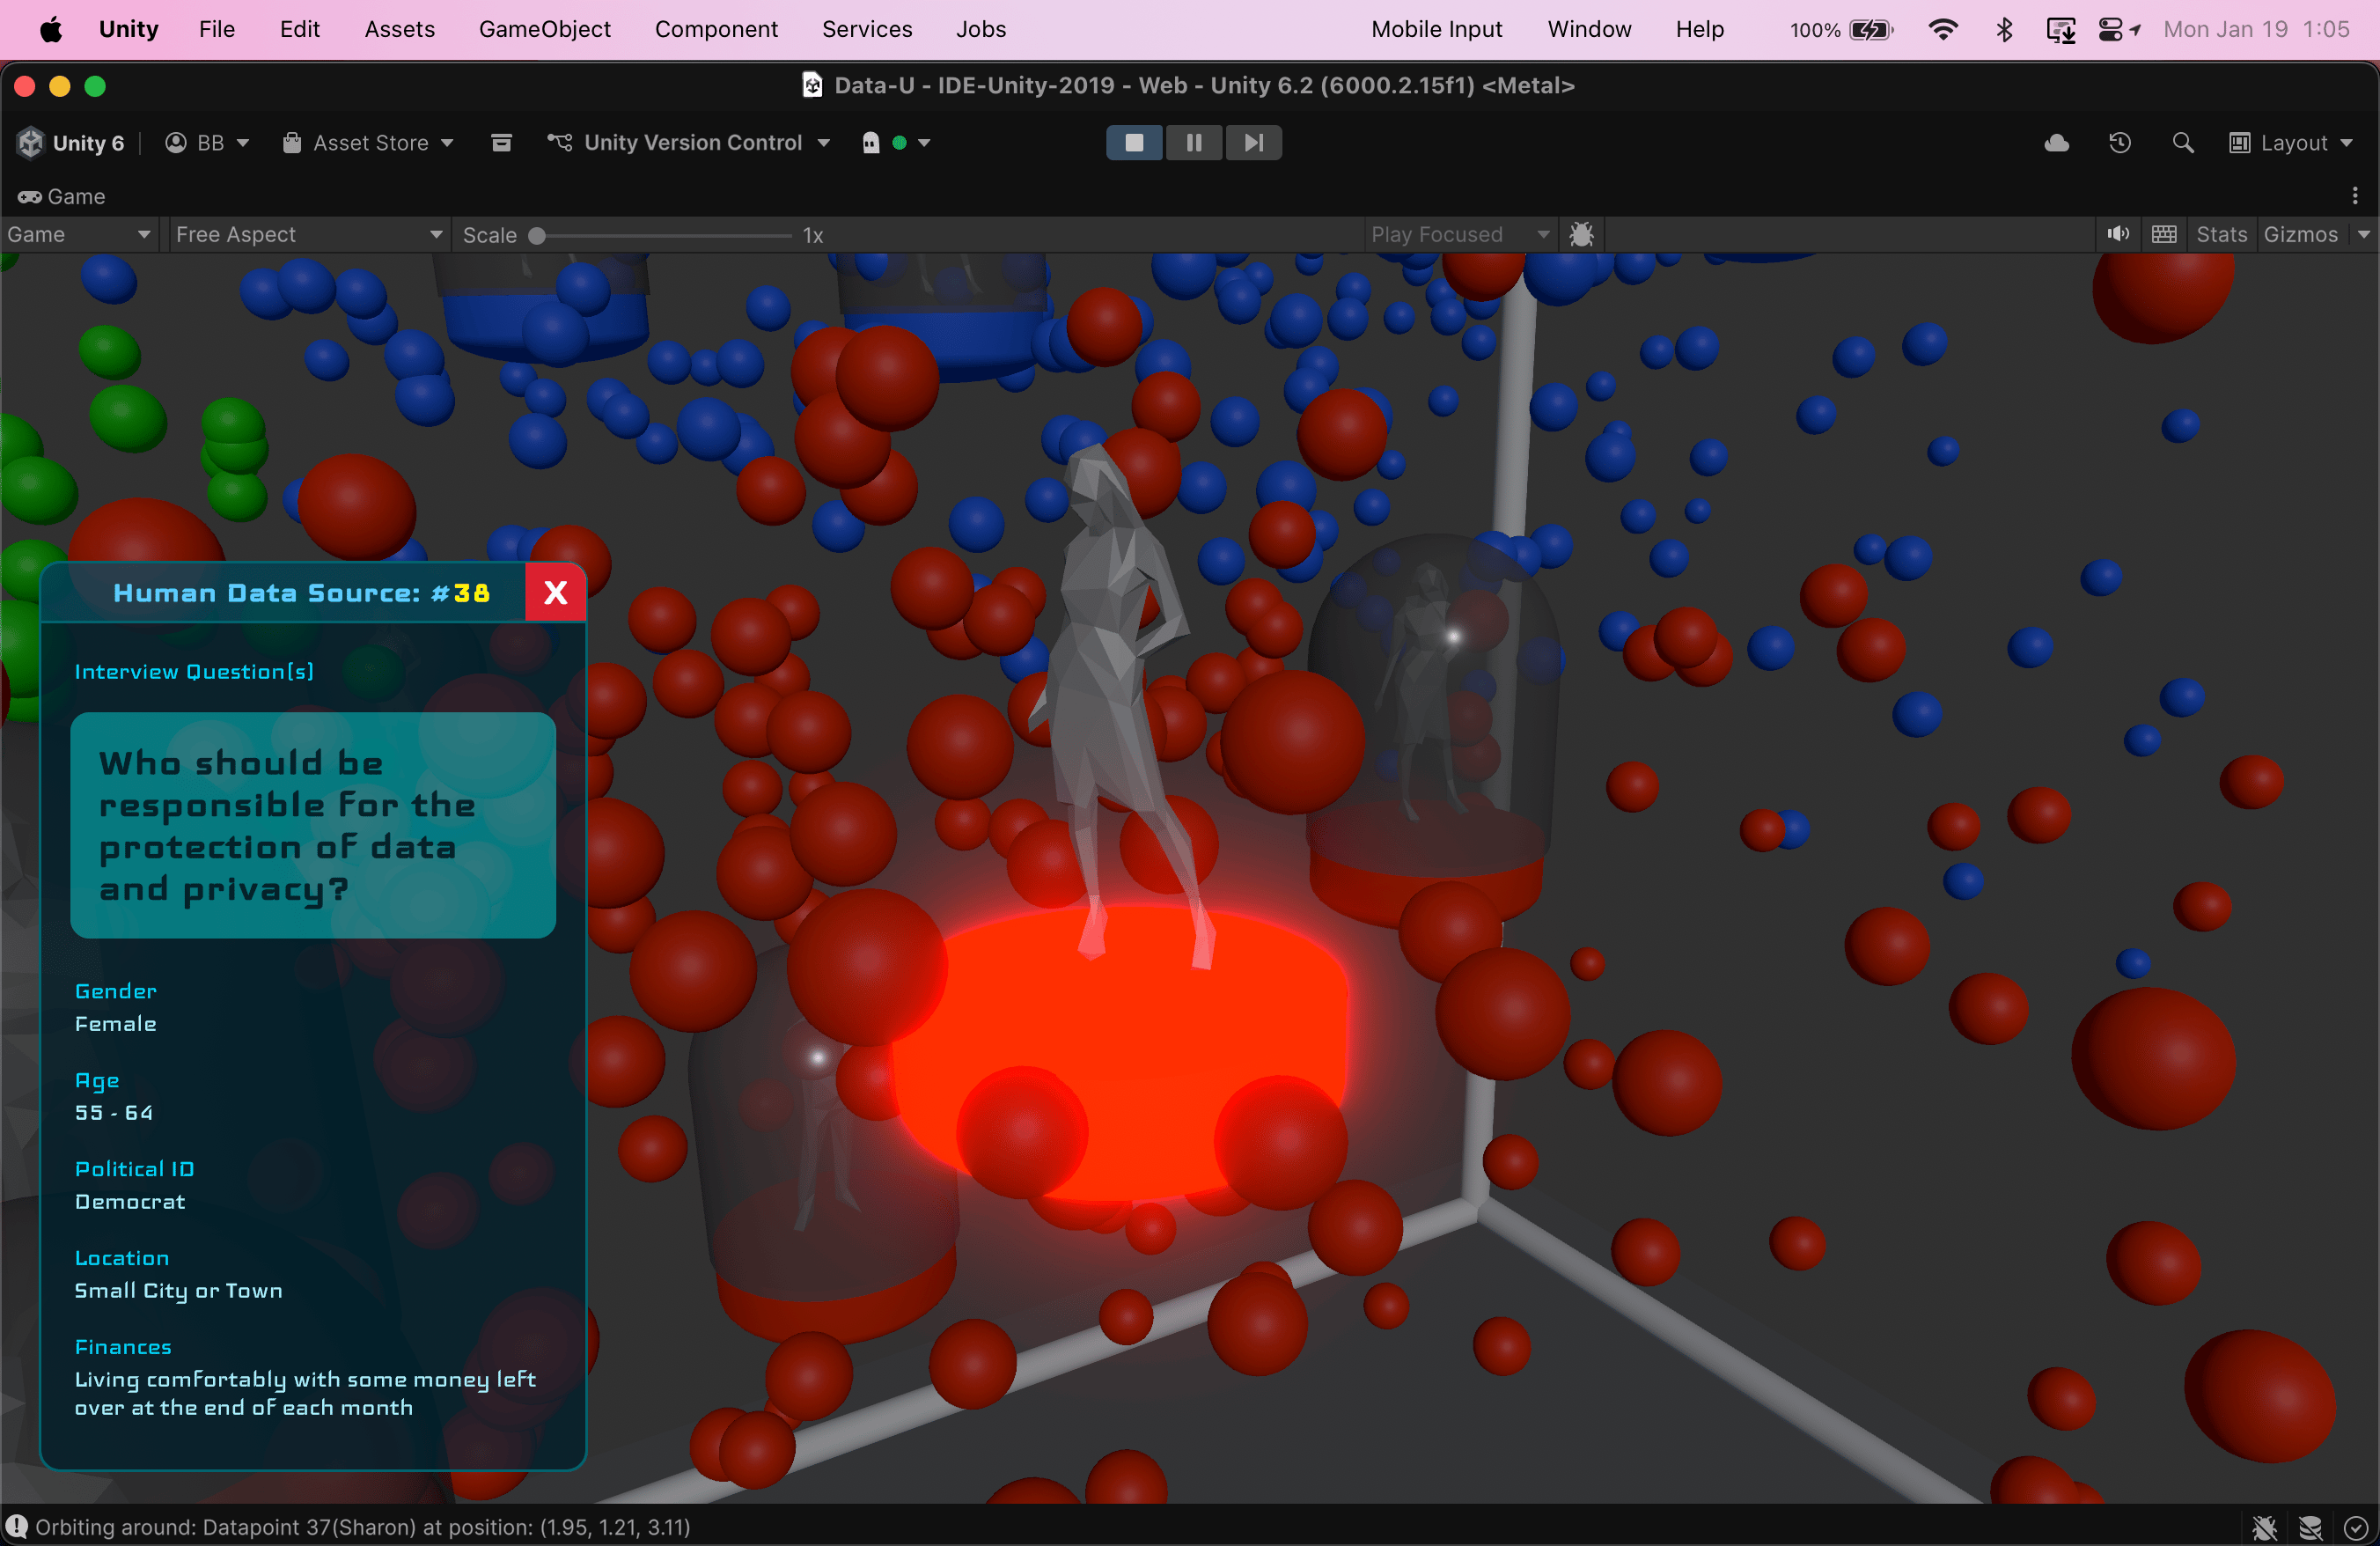
Using emissive shaders to create more visual depth in the scene
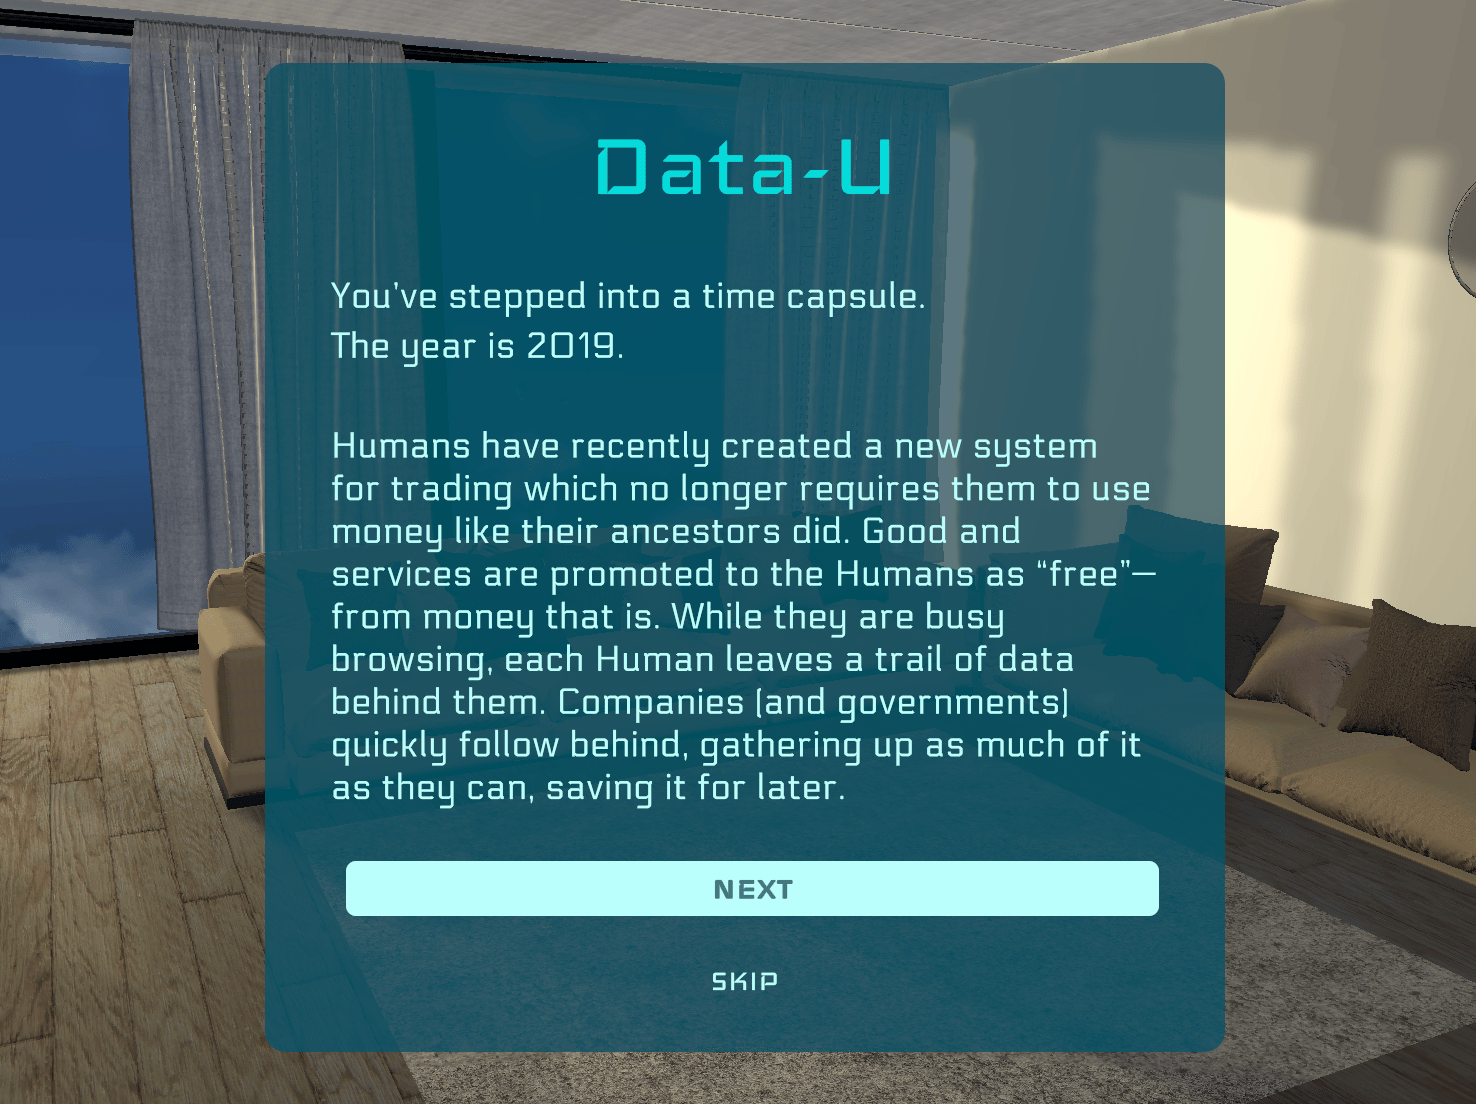
Adding more storytelling at the beginning of the experience to fabricate context, create an engaging transition, and give visitors the opportunity to get invested in the meaning of the data
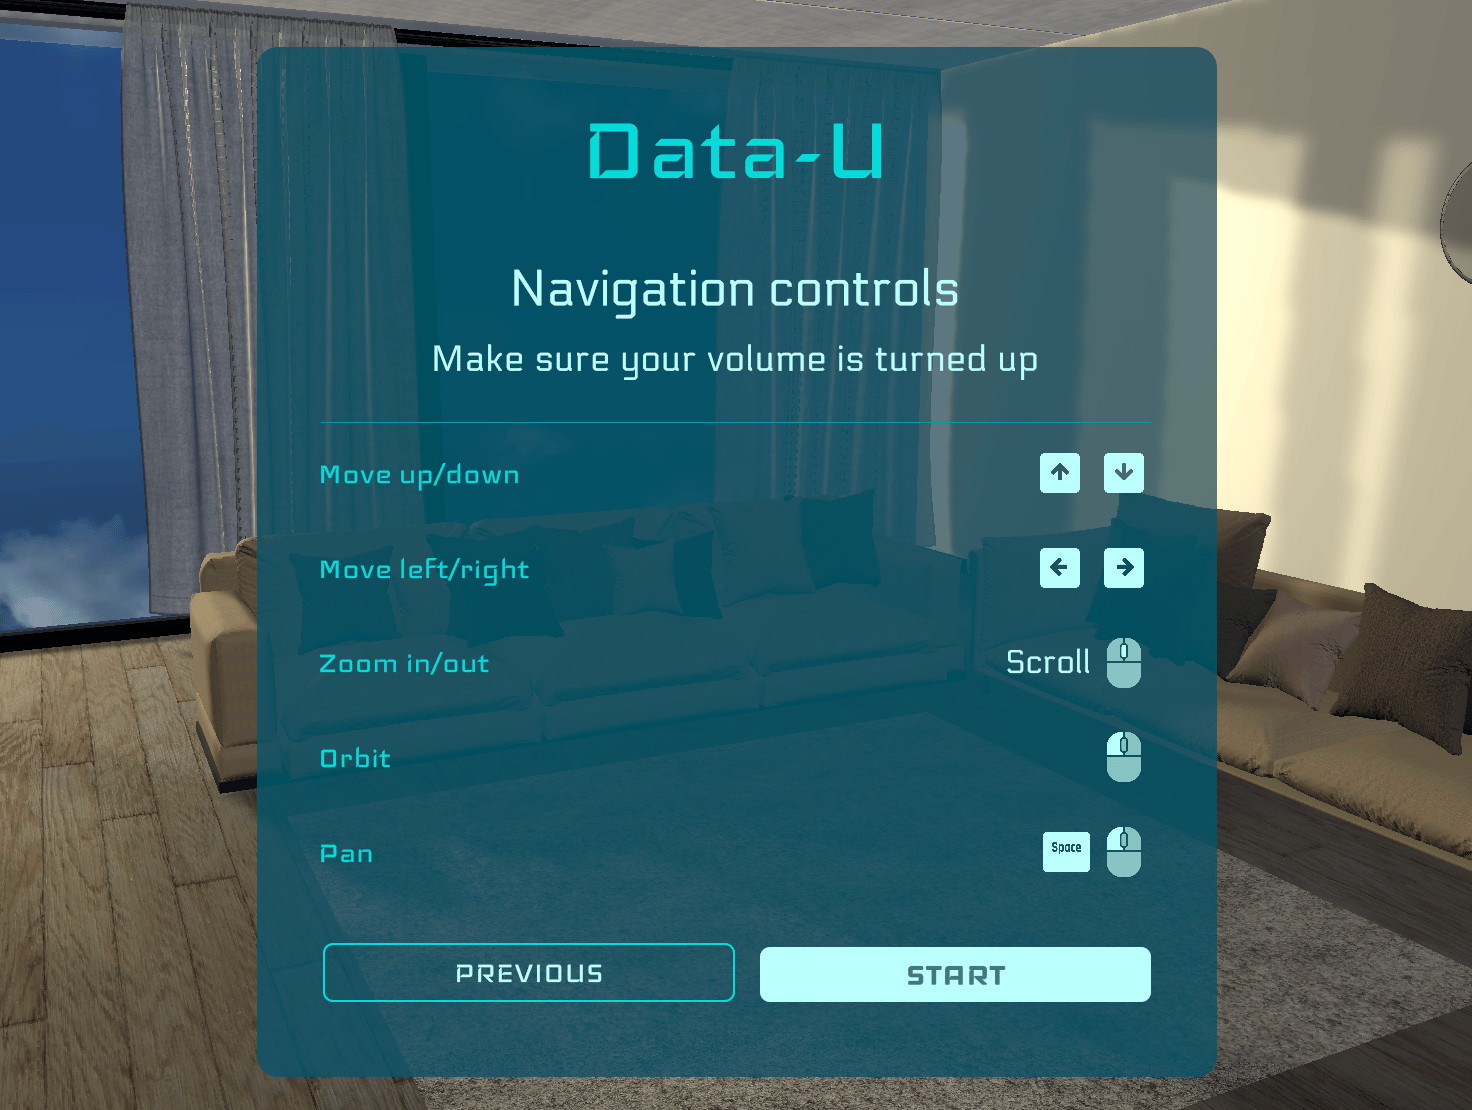
Rethinking and optimizing interaction and navigation paradigms to account for mouse and keyboard inputs and controls
Using 3D environment design to create the necessary elements of a simulated world to communicate a sense of scale and realism
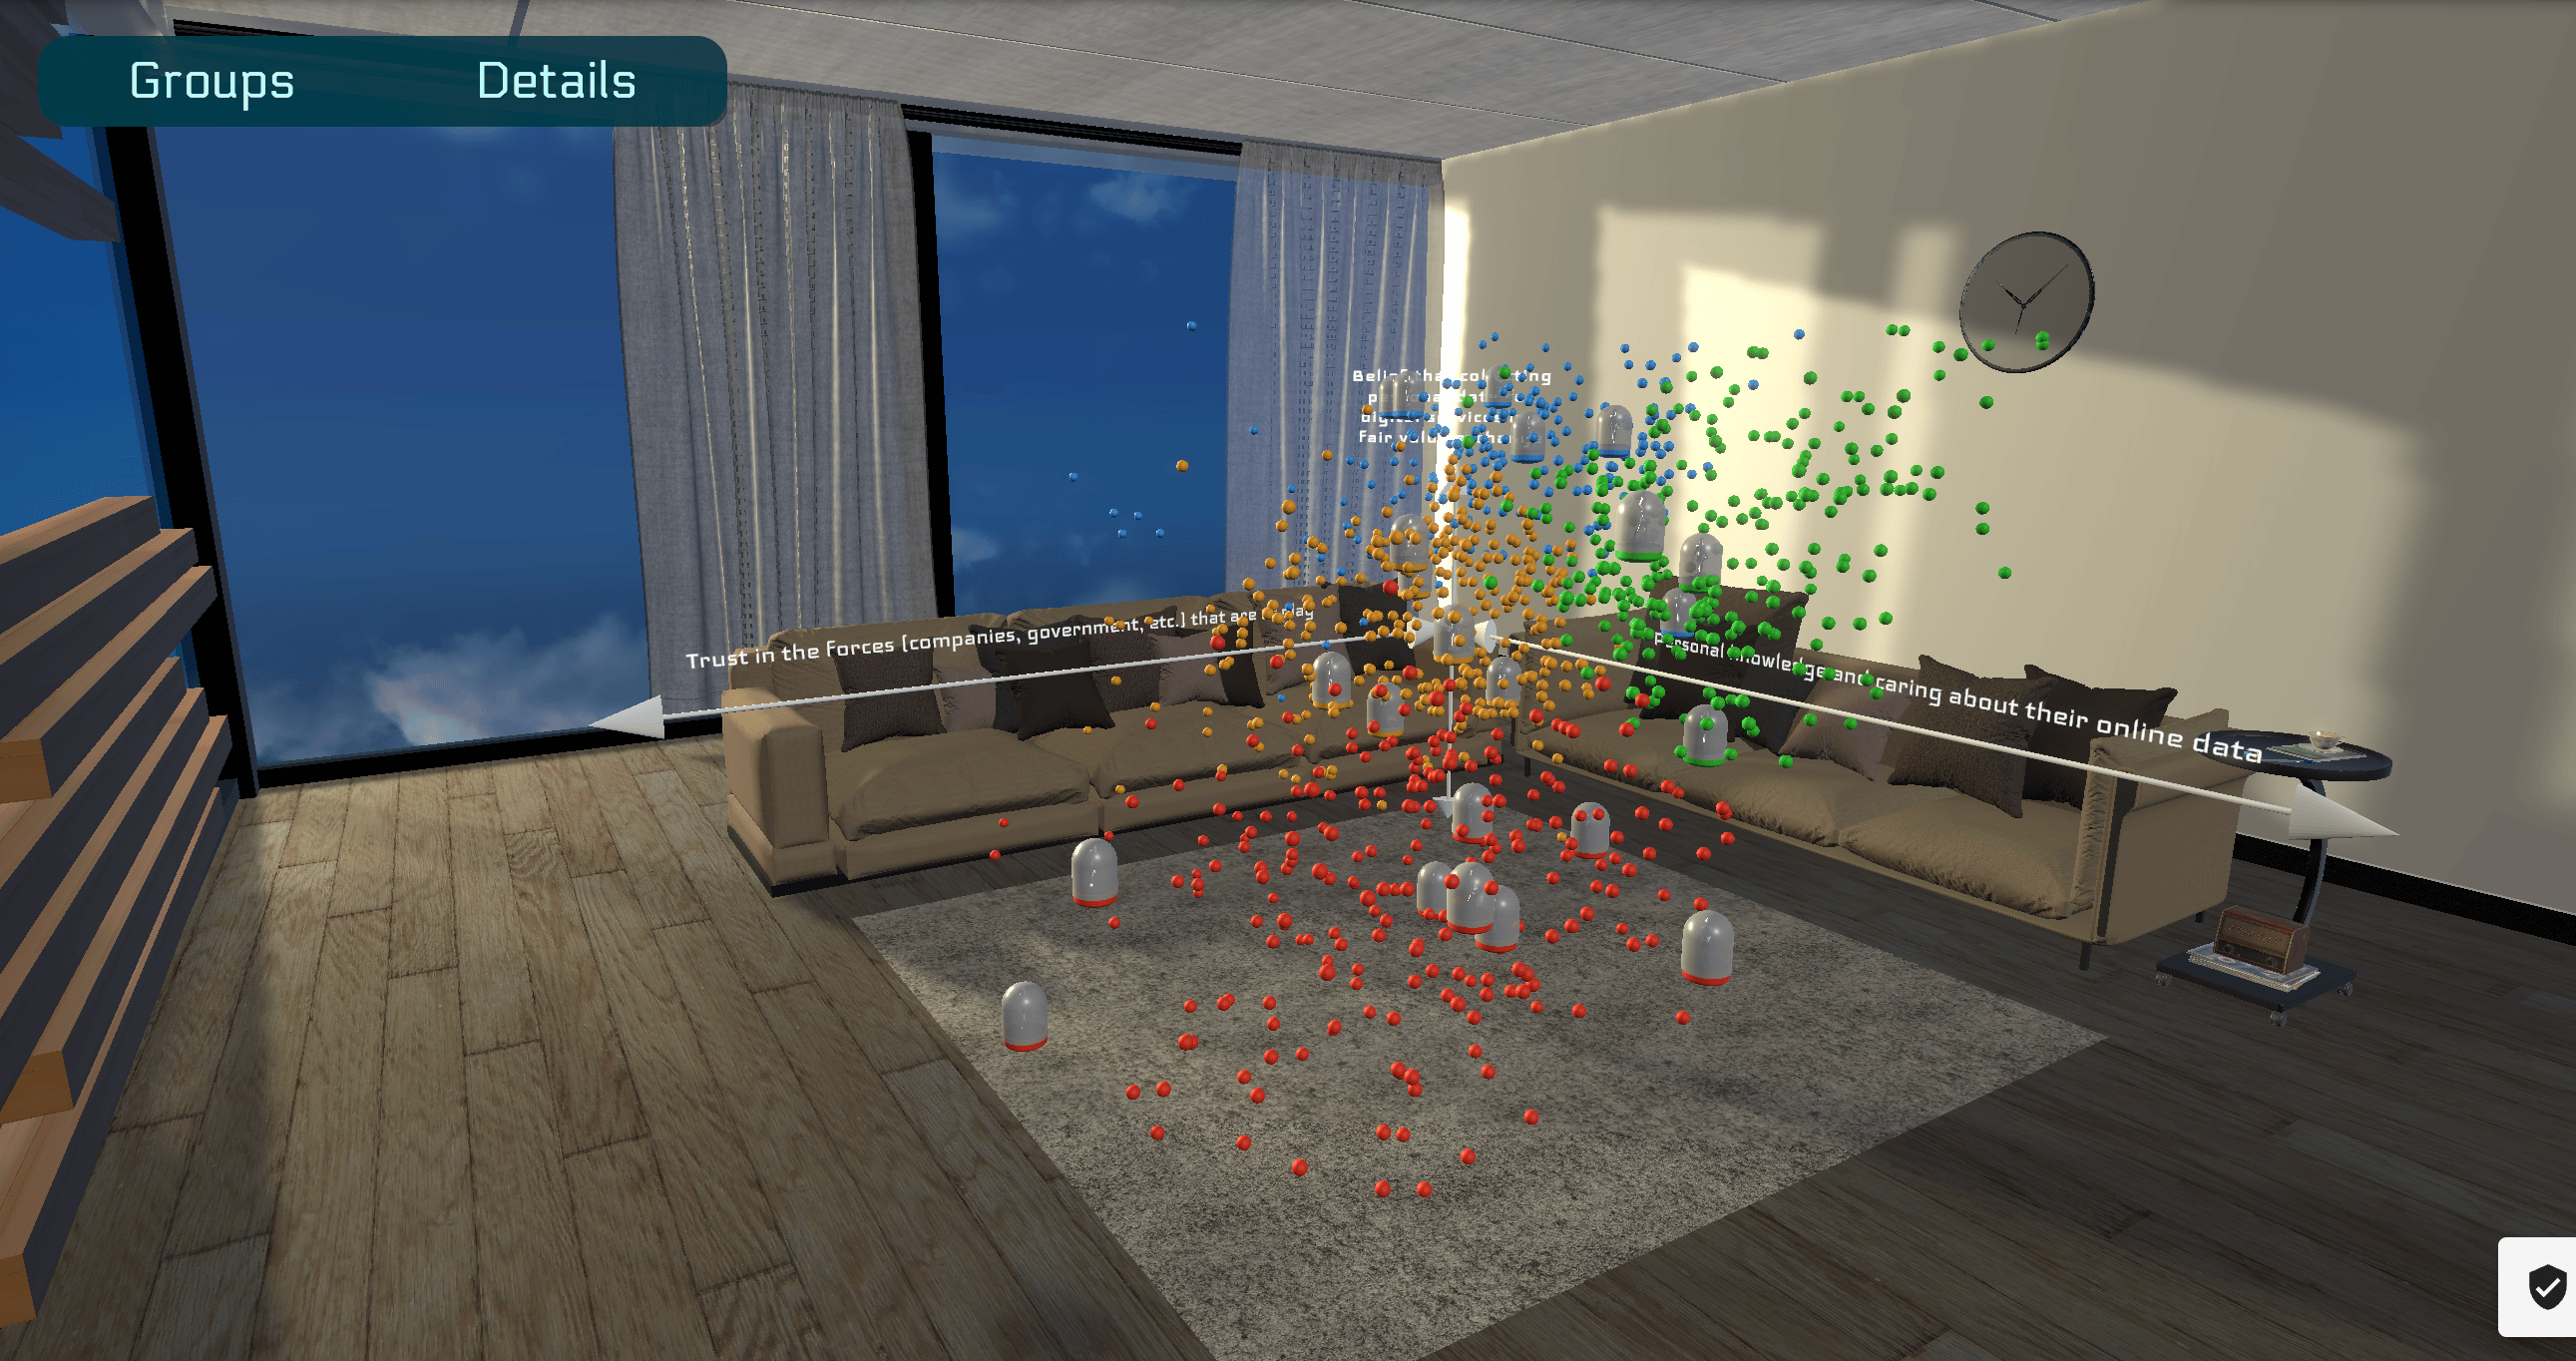
Designing multi-point lighting systems and rendering layers to create realistic sunlight and shadows